Tutorial 2: Continuation of cumulative production example#
In this tutorial, we pick up where we left off in Tutorial 1.
Testing the user task using the SDK#
Clearly, any sophisticated user task will require testing and debugging prior to creating the user task. This is where the usefulness of the Python SDK comes into play. From any Python IDE (such as PyCharm or Spyder), one can create, editand debug a user task script in Python. Here is how:
Copy the script from Tutorial 1 and save it to a file titled cumul_prod_task.py. Create another file named cumul_prod_task_simulation.py and a third named cumul_prod_task.yaml in the same directory. The .yaml file will describe the input/output of the user task. The cumul_prod_task_simulation.py file is the main Python file and will initialize the input and run the task. The remaining .py file will be the one you copy into the script text area in the UI. If you wish to download directly the final versions of the files, they are available in the following zip file.
Important
The proper naming of the .py and .yaml files is essential. If the user task file is named “user_task.py”, then the .yaml file must be named “user_task.yaml” and the main .py file must be named “user_task_simulation.py”.
The more error-free fashion to fill in the contents of the .yaml file is to first create the input/output using the KAPPA-Automate UI as described in Tutorial 1 and the user tasks section of the KAPPA-Automate help. Then, once the input and output are defined, select the “Advanced mode” check box and copy the contents of the parameter description into the “cumul_prod_task.yaml” file. The example from Tutorial 1 for the cumulative production task is given below:
 inputs:

     Rate:
       type: dataset
       mandatory: true
       dataType: qg
       isByStep: true

 outputs:

     Cumulative:
       type: dataset
       dataType: Qg
       isByStep: false
When you are more comfortable with the YAML syntax, this can be done by hand and through copy/paste. The next step is to create the SDK task simulation file, “cumul_prod_task_simulation.py”. First, we must import the necessary classes and create the connection to the KAPPA-Automate server.
 from kappa_sdk import Connection
 from kappa_sdk.user_tasks import Context
 from kappa_sdk.user_tasks.simulation import UserTaskInstance


 ka_server_address = 'https://your-ka-instance'

 print('Connecting to {}'.format(ka_server_address))
 connection = Connection(ka_server_address, verify_ssl=False)
Then we get the kappa_sdk.Field instance from the kappa_sdk.Connection.
 field_name = 'your field name'
 print("Reading [{}] field data...".format(field_name))
 field = next(x for x in connection.get_fields() if x.name == field_name)
Then we get the kappa_sdk.Well instance from the field.
 well_name = 'your well name'
 print("Reading [{}] well...".format(well_name))
 well = next(x for x in field.wells if x.name == well_name)
An essential next step is to initialize the context of the user task with the well and field ID values (UUID).
kappa_sdk.user_tasks.Context instance, with field and well UUID values.# context = Context()
context.field_id = field.id
context.well_id = well.id
The kappa_sdk.user_tasks.simulation.UserTaskInstance instance is created with the connection and context. This instance mimics the user task in the “_simulation.py” file. Following the creation of the kappa_sdk.user_tasks.simulation.UserTaskInstance instance, a kappa_sdk.Data instance representing the input rate data is created. The UUID of the vector (rate_data.vector_id) is passed to the task instance with the “inputs” attribute (line 8 below). The task is then run using kappa_sdk.user_tasks.simulation.UserTaskInstance.run().
 1 task = UserTaskInstance(connection, context)
 2
 3 print('Binding parameters..')
 4 rate_data_type = 'qg'
 5 rate_name_prefix = 'GAS - '
 6 print("  [->] Well Name = {}".format(task.well.name))
 7 rate_data = next(x for x in task.well.data if x.data_type == rate_data_type and x.name.startswith(rate_name_prefix))
 8 print("  [->] Rate Name = {}".format(rate_data.name))
 9 task.inputs['Rate'] = rate_data.vector_id
10
11 task.run()
Running the user task code using the SDK and a “_simulation.py” file is referred to as running in “simulation mode”.
User Task Context#
Important
When one or more datasets of a user task are updated (for example, when new data arrive), the user task is re-executed automatically.
One may have noted that the user task described above always recalculates the cumulative production from zero. Thus, every time a new rate value would be recorded, the entire cumulative production would be recalculated. The calculation for this user task is very lightweight, so this inefficiency may not be significant. However, for complex tasks we may want to only process new rate data that come inand append new cumulative values to the existing cumulative production dataset. We can do this using kappa_sdk.user_tasks.Context. A user task context is essentially a dictionary that can hold low-level Python objects (float, string, int, etc.).
Processing only new data#
An example of how we can use the kappa_sdk.user_tasks.Context instance to process only new data is shown below.
Note use of kappa_sdk.user_tasks.data_command_service.DataCommandService.add_values(), which will append new cumulative production values to any pre-existing values which have been calculated.
As mentioned above, context can contain values of primitive types only, e.g. values of datetime type needs to be converted to/from string.
We provide a code fragment on how to use the the kappa_sdk.user_tasks.Context instance to process new data here.
Delayed processing of new data#
If there is new rate data arriving every second, this user task would be called very frequently and unnecessarily block other user tasks from being processed. One solution is to launch a new processing of the data only when a certain amount of new data has been accumulated. This can be done with the aid of the kappa_sdk.user_tasks.Context instance. You can find a code snippet on how to delay processing of new data here.
Important
Use the user task context to control the execution times of the user task.
User Task Scheduler#
Note
Use kappa_sdk.user_tasks.Scheduler for long-running user tasks which can be broken into smaller subtasks.
A user task may contain a very time-consuming calculation. Ideallyand if possible, we should free up the processes which are occupied by the user task for other tasks.
We can use kappa_sdk.user_tasks.Scheduler for this. Please refer to the a short explanation and code snippet here.
Adding flexibility to user tasks through JavaScript#
In our script you may have noticed that the input and output data types are hard-coded to qg/Qg. If we had no recourse, we would have to duplicate the code and create another user task to calculate the cumulative oil production. Fortunately, we can use JavaScript to change data type dynamically when the user task is created. This can be done in “Advanced mode” when the user task is created.
One JavaScript example is shown below. When creating the cumulative production user task, add an extra Boolean as shown below in in Fig. 9.
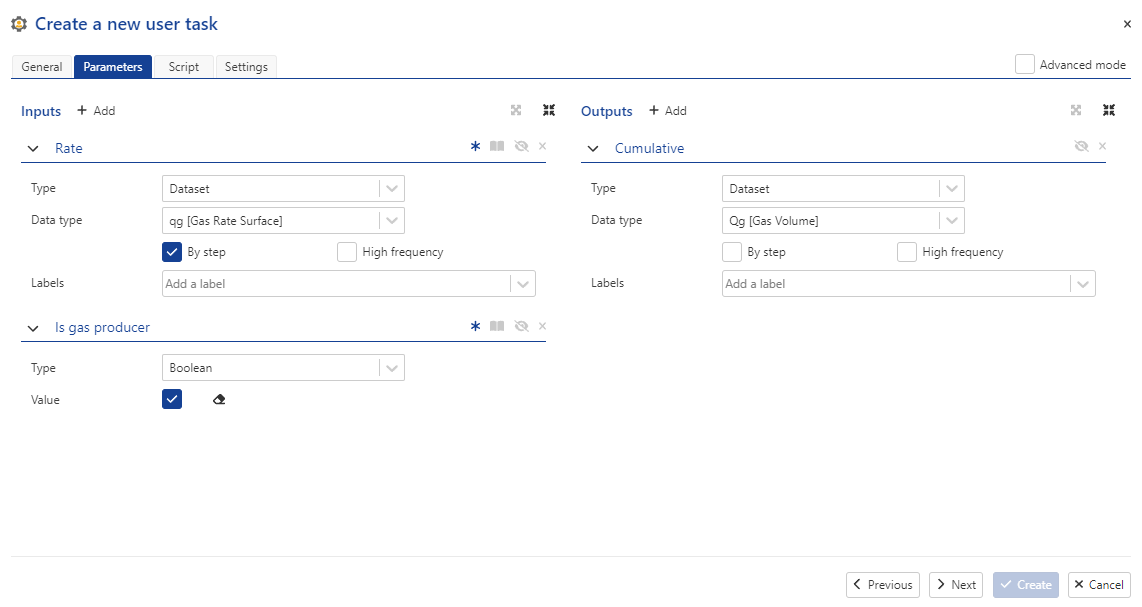
Fig. 9 An extra Boolean “Is gas producer” has been added to the input of the user task.#
Then, click on the “Advanced mode” check box on the upper right. This displays the underlying .yaml description for the input/output parametersand an additional text area for JavaScript code.
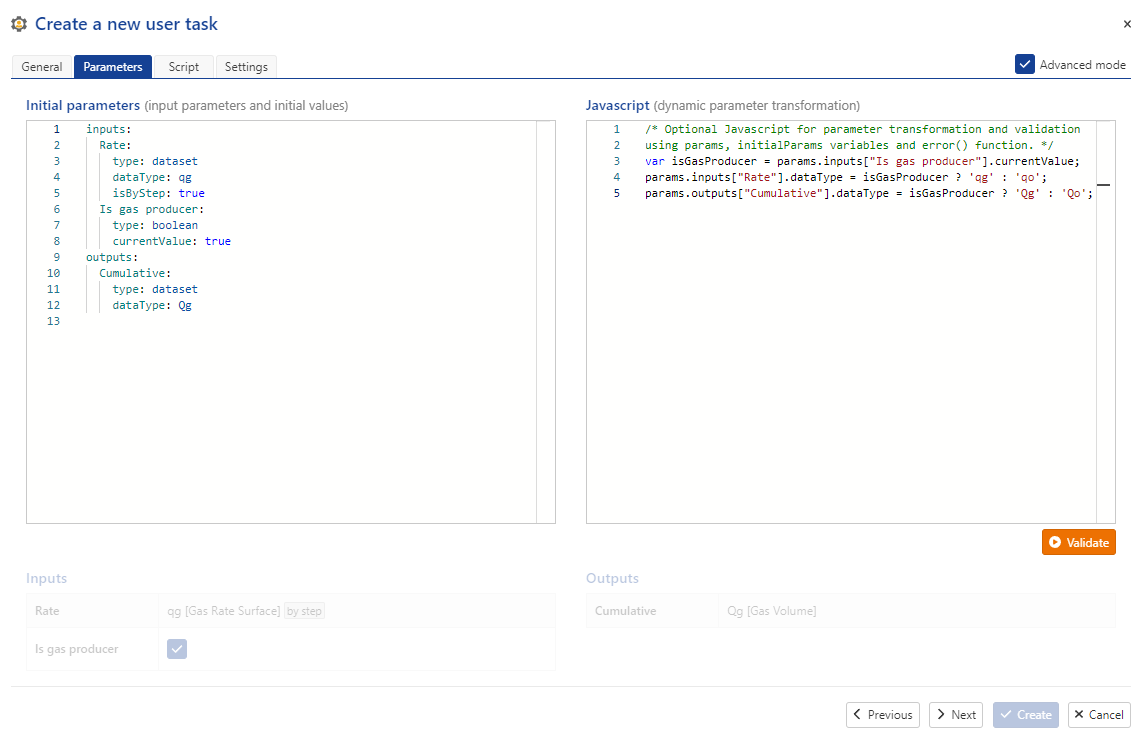
Fig. 10 Selecting the “Advanced mode” check box on the upper right of the dialog displays the .yaml description for the input/output parametersand an additional text area for JavaScript code.#
JavaScript code has been added in Fig. 10 which modifies dynamically the datatypes of the input rate and output cumulative production following the value of the “Is gas producer” Boolean.
Plotting using the custom plot API#
By default, point data are plotted with points only, with no lines connecting the points. Users can create new plots using the classes kappa_sdk.Plot and kappa_sdk.PlotChannel as shown below in Listing 13. The plot will appear under the user task node, in a sub-node titled “Plots”, due to kappa_sdk.UserTask.create_plot(). The method kappa_sdk.Plot.add_existing_data() adds the data to the specified pane on the plot. The method kappa_sdk.PlotChannel.set_lines_aspect() allows the user to define how the line is drawn (color, thicknessand style). Finally, kappa_sdk.Plot.update_plot() creates the new plot with the pane(s) and data that have been previously defined.
this_task = services.user_task  # <== Get a handle to the user task
new_plot = this_task.create_plot(plot_name, pane_name)  #  <== Create a new plot under the user task node with the plot name and pane name
cumulative_data = next(x for x in this_task.outputs if x.vector_id == cumulative_vector_id)
plot_name = 'Cumulative production'
pane_name = 'Time vs Cumulative'
new_plot = this_task.create_plot(plot_name, pane_name)
channel_name = 'Cumulative'
series1 = new_plot.add_existing_data(cumulative_data, channel_name, show_symbols=False, show_lines=True)
series1.set_lines_aspect(style=LineAspectEnum.solid)
new_plot.update_plot()
When in simulation mode, the new plot will appear under the “Plots” node, found directly under the well node.
When the data that are passed to kappa_sdk.Plot.add_existing_data() are of type kappa_sdk.Data (such as in this tutorial), the plot will automatically update when new data arrives. In this case, we only need to call the above code once. This can be done as shown in the code in Listing 14 below.
this_task = services.user_task # <== Get a handle to the user task
plot_name = 'Cumulative production'
plot = next((x for x in this_task.plots if x.name == plot_name), None)
if plot is None:
    # Plot has not been created yet
    cumulative_data = next(x for x in this_task.outputs if x.vector_id == cumulative_vector_id)
    pane_name = 'Time vs Cumulative'
    new_plot = this_task.create_plot(plot_name, pane_name)  #  <== Create a new plot under the user task node with the plot name and pane name
    channel_name = 'Cumulative'
    series1 = new_plot.add_existing_data(cumulative_data, channel_name, show_symbols=False, show_lines=True)
    series1.set_lines_aspect(style=LineAspectEnum.solid)
    new_plot.update_plot()
Full tutorial code content#
Within the code fold you will find a full example of the tutorial, also available in the zip file. The code contains an example usage of delayed processing, as well as the use of JavaScript.
Click to view the full contents of tutorial_2.py
 1from kappa_sdk.user_tasks.user_task_environment import services
 2from datetime import datetime
 3from kappa_sdk import LineAspectEnum
 4
 5
 6services.log.info('Start of cumulative production calculation user task')  # <== Add logs to follow your code
 7
 8rate_vector_id = str(services.parameters.input['Rate'])  # <== This is how we obtain the ID of the input rate vector
 9cumulative_vector_id = str(services.parameters.output['Cumulative'])
10
11last_date_string = services.context['last_date_read']  # <== Get the string representation of last date of data which has been processed.  None if key is not in context.
12last_date = datetime.fromisoformat(last_date_string) if last_date_string is not None else None  # <== Convert date to datetime object
13last_cum_prod: float = services.context['last_cum_prod'] if services.context['last_cum_prod'] is not None else 0.0
14
15rate_data = next(x for x in services.well.data if x.vector_id == rate_vector_id)
16
17gauge_has_enough_data = rate_data.size > 0  # <== Boolean which controls whether the user task will calculate the cumulative production
18
19if last_date is not None and rate_data.last_x is not None:
20    ONE_WEEK = 7 * 24  # Time is in hours
21    accumulated_time_of_rate_date = (rate_data.last_x - last_date).total_seconds() / 3600.0  # Time is in hours
22    if accumulated_time_of_rate_date < ONE_WEEK:
23        gauge_has_enough_data = False  # <== There is not enough data
24
25if gauge_has_enough_data and rate_data.first_x is not None and rate_data.last_x is not None:
26    ##################################################################
27    #  Only do processing if there is enough data
28    ##################################################################
29    if last_date is None:
30        rate_vector = rate_data.read()
31    else:
32        rate_vector = rate_data.read(from_time=last_date)
33
34    dates = rate_vector.dates
35    times = rate_vector.elapsed_times
36    values = rate_vector.values
37
38    cum_prod: List[float] = list()
39    date_list: List[datetime] = list()
40    if last_date is None:
41        cum_prod.append(0)
42        date_list.append(rate_data.first_x)
43        first_delta = (dates[0] - rate_data.first_x).total_seconds()
44        cum_prod.append(first_delta * values[0])
45    else:
46        first_delta = (dates[0] - last_date).total_seconds()
47        cum_prod.append(first_delta * values[0] + last_cum_prod)
48
49    for i in range(1, len(times)):
50        delta_t = times[i] - times[i - 1]
51        delta_t_seconds = delta_t * 3600.0
52        cum_prod.append(delta_t_seconds * values[i] + cum_prod[-1])
53    date_list.extend(dates)
54
55    services.context['last_date_read'] = dates[-1].isoformat()
56    services.context['last_cum_prod'] = cum_prod[-1]
57    services.data_command_service.add_values(cumulative_vector_id, date_list, cum_prod)
58
59    this_task = services.user_task
60    plot_name = 'Cumulative production'
61    plot = next((x for x in this_task.plots if x.name == plot_name), None)
62    if plot is None:
63        # Plot has not been created yet
64        cumulative_data = next(x for x in this_task.outputs if x.vector_id == cumulative_vector_id)
65        pane_name = 'Time vs Cumulative'
66        new_plot = this_task.create_plot(plot_name, pane_name)
67        channel_name = 'Cumulative'
68        series1 = new_plot.add_existing_data(cumulative_data, channel_name, show_symbols=False, show_lines=True)
69        series1.set_lines_aspect(style=LineAspectEnum.solid)
70        new_plot.update_plot()
Click to view the full contents of tutorial_2.js
var isGasProducer = params.inputs["Is gas producer"].currentValue;
params.inputs["Rate"].dataType = isGasProducer ? 'qg' : 'qo';
params.outputs["Cumulative"].dataType = isGasProducer ? 'Qg' : 'Qo';
Click to view the full contents of tutorial_2_simulation.py
 1from kappa_sdk import Connection
 2from kappa_sdk.user_tasks import Context
 3from kappa_sdk.user_tasks.simulation import UserTaskInstance
 4
 5
 6ka_server_address = 'https://your-ka-instance'
 7print('Connecting to {}'.format(ka_server_address))
 8connection = Connection(ka_server_address, verify_ssl=False)
 9
10field_name = 'your field name'
11print("Reading [{}] field data...".format(field_name))
12field = next(x for x in connection.get_fields() if x.name == field_name)
13
14well_name = 'your well name'
15print("Reading [{}] well...".format(well_name))
16well = next(x for x in field.wells if x.name == well_name)
17well_id = well.id
18
19context = Context()
20context.field_id = field.id
21context.well_id = well.id
22
23task = UserTaskInstance(connection, context)
24
25print('[Tutorial 2] Binding parameters..')
26rate_data_type = 'qg'
27rate_name_prefix = 'GAS - '
28print("  [->] Well Name = {}".format(task.well.name))
29rate_data = next(x for x in task.well.data if x.data_type == rate_data_type and x.name.startswith(rate_name_prefix))
30print("  [->] Rate Name = {}".format(rate_data.name))
31task.inputs['Rate'] = rate_data.vector_id
32task.inputs['Is gas producer'] = True
33
34task.run()
Creating a user task and viewing output#
Create the user task instance for the well following what is described in Tutorial 1 and the KAPPA-Automate Help. When execution starts, the “Info” tabbed pane will show the user task as “Running”. The “Plot” tab will show all output that the user task creates. In addition, sub-nodes below the user task node will display information and plots for all output (Fig. 11).
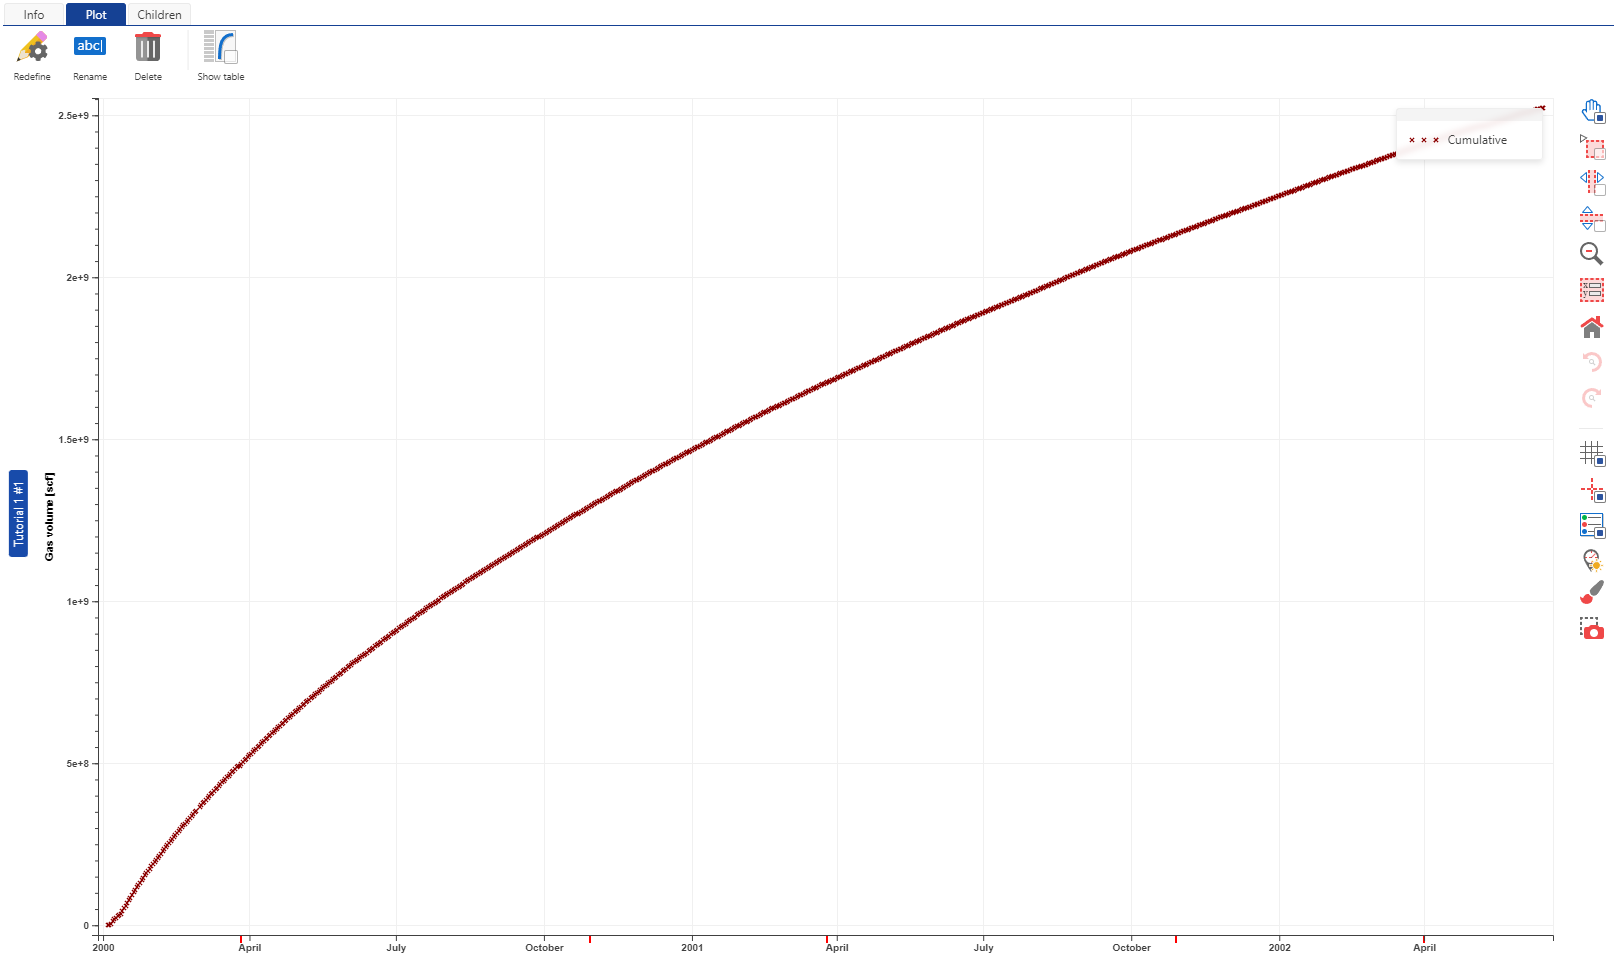
Fig. 11 Output of the Tutorial 2 user task for a well. The cumulative production output itself is available as a node under the user task.#
Further notes#
Alternatively to using the Boolean, one could specify an “Enum” input type as shown in Fig. 12. This is simply a selection of strings which are defined in the UI.
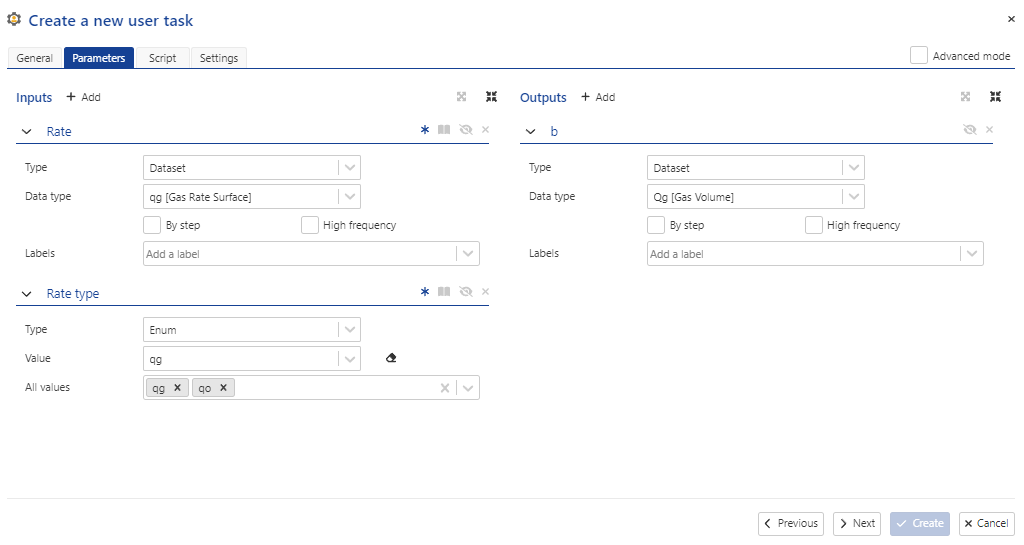
Fig. 12 One could alternatively employ a “Rate type” input value which is of type Enum to specify the datatype. Enum is useful when there are more than two choices.#
The appropriate JavaScript code is shown in Fig. 13 which uses the Enum input “Rate type” to modify the datatype dynamically.
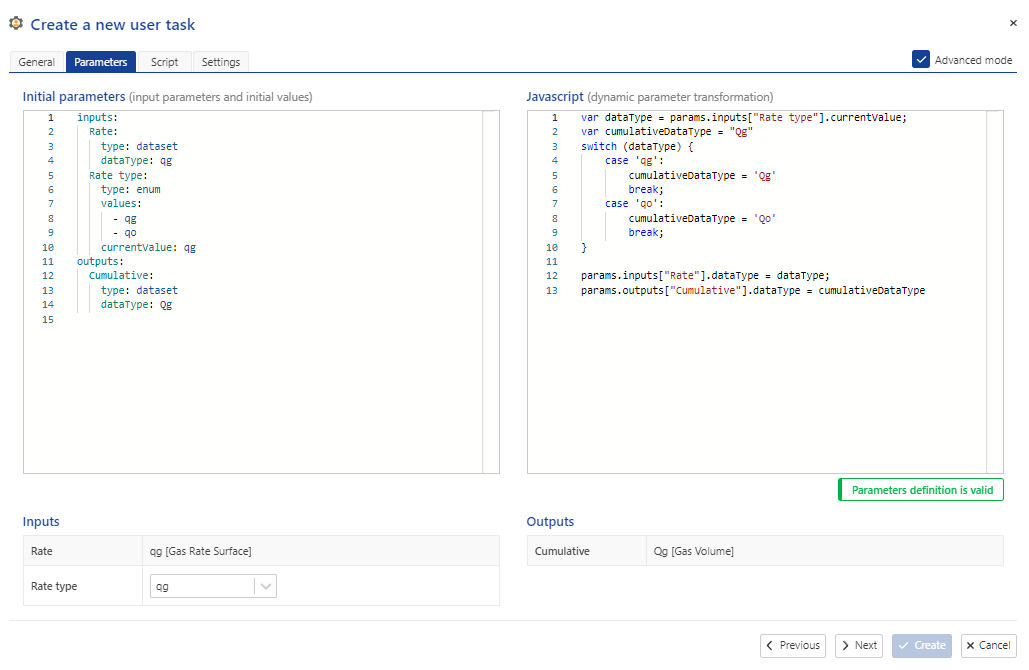
Fig. 13 The JavaScript code to modify the datatypes using an Enum input is shown using the “Advanced mode” viewing.#
Calculating production for one or more rates#
Another option for this user task is to allow for one or two rates to be inputand calculate the cumulative production for one or both rates. This can be done by making the input rates optional (by default, input datasets are mandatory). Fig. 14 shows the UI for parameter definition.
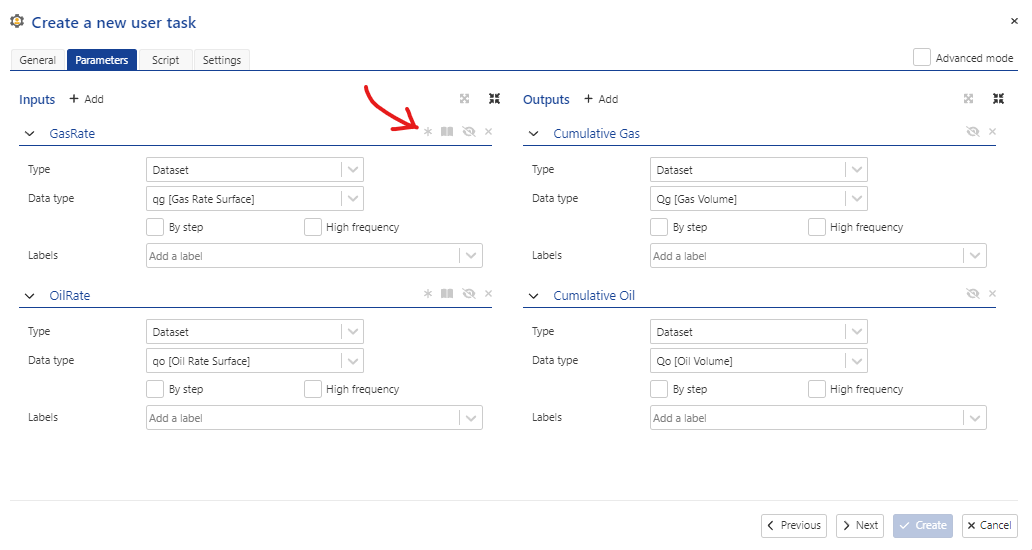
Fig. 14 The parameter definition tabbed pane for two, optional input rate values. The red arrow indicates which icon must be deselected in order for the inputs to be optional.#
The corresponding .yaml definition for Fig. 14 is shown below in Listing 18:
 inputs:
   GasRate:
     type: dataset
     dataType: qg
     mandatory: false
   OilRate:
     type: dataset
     dataType: qo
     mandatory: false
 outputs:
   Cumulative Gas:
     type: dataset
     dataType: Qg
   Cumulative Oil:
     type: dataset
     dataType: Qo
In the Python script, optional input parameters can be tested for initialization as in the example code below:
 if services.parameters.input['GasRate'] is not None:
     #  (Code to process gas rate)
     ...

 if services.parameters.input['OilRate'] is not None:
     #  (Code to process oil rate)
     ...
Output to well properties#
In addition to creating new datasets, we can also modify our user task to output the total cumulative production as a well property. Let us assume that a well property has been already been created in the master well property container. To output a property in the user task, we simply add the following code:
ALIAS = 'Current_Cumulative_Production'
well_property_container = next(x for x in services.well.well_property_containers if x.is_master)
well_property_container.set_well_property_value(ALIAS, cum_prod[-1])