Tutorial 4: Using the RTA Micro-service#
This tutorial builds upon Tutorial 3. Here, the filtered and decimated rates and pressure values will be uploaded to a Topaze document (already uploaded to the well)and a new model will be executed using the RTA micro-service.
This tutorial emphasizes the use of the micro-service, the extraction of the simulation resultsand the updating of model parameters.
The code for Tutorial 4 can be found in this zip file.
An additional input - Topaze file#
There is one additional input for this tutorial along with what is shown in Tutorial 3.
    Topaze file:
      type: file
      readOnly: false
      mandatory: true
Click to view the full contents of tutorial_3.yaml
inputs:

    Rate:
      type: dataset
      mandatory: true
      dataType: qo
      isByStep: true

    Pressure:
      type: dataset
      mandatory: true
      dataType: BHP
      isByStep: false

    Window size:
      type:  int
      currentValue: 11
      mandatory: true

    Time decimation:
      type: double
      dimension: LargeTime
      currentValue: 168

    Topaze file:
      type: file
      readOnly: false
      mandatory: true

outputs:

    Filtered pressure:
      type: dataset
      dataType: BHP
      isByStep: false

    Decimated rates:
      type: dataset
      dataType: qo
      isByStep: true
User task script: Specifying the model#
The Topaze file is represented by a kappa_sdk.Document instance. The model input is described in xml format. The kappa_sdk.Document.set_model_xml() method accepts the xml file representing the model input (or optionally, only the input which is different in the Topaze model in the kappa_sdk.Document instance)and then runs a “Generate” or an “Improve”.
An example is shown in the code snippet in Listing 30. A kappa_sdk.ModelParser instance parses an xml and sets new parameter values using kappa_sdk.ModelParser.set_parameter_value(). The method kappa_sdk.ModelParser.export() creates the new xml, which is sent to the kappa_sdk.Document instance (“topaze_doc”) using kappa_sdk.Document.set_model_xml(). This method will run a “Generate” (by default) and give a return message if the execution is not successful.
...
delta, k, xmf = x

parser = ModelParser(model_xml)
parser.set_parameter_value(topaze_doc.analyses[0].id, "KWKA_RES_PAR",
                           {"Type": "FRACTIONAL_DIMENSION", "ZoneIndexX": "1"}, str(delta))
k = np.power(10, k)
internal_perm = services.unit_converter.convert_to_internal(UnitEnum.perm_milli_darcy, k)
parser.set_parameter_value(topaze_doc.analyses[0].id, "KWKA_RES_PAR",
                           {"Type": "PERMEABILITY"}, str(internal_perm))
xmf = np.power(10, xmf)
internal_xmf = services.unit_converter.convert_to_internal(UnitEnum.length_feet, xmf)
parser.set_parameter_value(topaze_doc.analyses[0].id, "KWKA_WELL_PAR",
                           {"Type": "FRACTURE_XF"}, str(internal_xmf))

# get the updated xml
new_model_xml = parser.export()
ret = topaze_doc.set_model_xml(new_model_xml)

if not ret.is_success:
    services.log.error(ret.message)
...
The file “model_xml” can be retrieved preceding Listing 30 using kappa_sdk.Document.get_model_xml().
# Retrieve the model xml file
model_xml = topaze_doc.get_model_xml()
Now that we have our code to modify a model (via the xml), re-run the modeland extract the results, we can do something interesting such as run a least squares optimization using SciPy. After the import statements we have three functions: the first updates the model xml and runs the RTA micro-service, the second calculates the least squares residualand the third runs the least squares optimization. Following these function definitions, the Python code from Tutorial 2 is repeated (without the plotting). Finally, we have the code where the model xml is extracted and the optimization code is called.
Plotting the regression results#
We are going to plot the results of the least squares regression by extracting them from the model and not from the output of a user task. In this case, we must refresh the plot programmatically within the user task. The first step is to check if the plot has already been created. If so, then the plot can be retrieved, deleted and re-created. See Listing 31
this_task = services.user_task
plot_name = 'Regression Summary'
plot = next((x for x in this_task.plots if x.name == plot_name), None)
if plot is not None:
    plot.delete()
Then, we pass the data to the plot in the form of a list containing the x,y points.
#  Setting up data for plotting
data_measure = 'LiquidRateSurface'
historical_name = 'Decimated rates'
simulated_name = 'Simulated oil rate'
(data_times, data_values), (sim_times_init, sim_init) = run_topaze(x_init, model_xml, topaze_doc, data_measure, historical_name, simulated_name)
date_list = list()
for x in data_times:
    new_date = first_date + datetime.timedelta(hours=x)
    date_list.append(new_date)
sim_init_list = list()
for x in sim_times_init:
    new_date = first_date + datetime.timedelta(hours=x)
    sim_init_list.append(new_date)

my_data_type = PlotDataTypesEnum.oil_rate_surface
data_series = summary_plot.add_embedded_data(Vector(date_list, data_values, first_date), 'Data', pane_name, show_symbols=False,
                                             first_x=first_date, show_lines=True, data_type=my_data_type, is_by_step=True, use_elapsed=False)
data_series.set_lines_aspect(style=LineAspectEnum.dash)
init_series = summary_plot.add_embedded_data(Vector(sim_init_list, sim_init, first_date), 'Initial', pane_name, show_symbols=False,
                                             first_x=first_date, show_lines=True, data_type=my_data_type, is_by_step=True, use_elapsed=False)
init_series.set_lines_aspect(style=LineAspectEnum.dot)
The plot is then updated in the usual fashion by kappa_sdk.Plot.update_plot().
The full Python script#
The full user task script is shown below in Listing 33.
Note
Running a least squares optimization in this manner will be much slower than running an “Improve” within the RTA micro-service. This example is given for demonstration purposes only.
  1from kappa_sdk.user_tasks.user_task_environment import services
  2import tutorial_4_utility as utility
  3import datetime
  4from kappa_sdk import KWModuleEnum, UnitEnum
  5from kappa_sdk import ModelParser, Document
  6import numpy as np
  7import numpy.typing as npt
  8from scipy.interpolate import interp1d
  9from scipy import optimize
 10import math
 11from kappa_sdk import Plot, PlotDataTypesEnum, LineAspectEnum, Vector
 12from typing import Tuple, List, cast
 13from uuid import UUID
 14
 15
 16def run_topaze(x: Tuple[float, float, float], model_xml: str, topaze_doc: Document, data_measure: str, historical_name: str, simulated_name: str) \
 17        -> Tuple[Tuple[List[float], List[float]], Tuple[List[float], List[float]]]:
 18    delta, k, xmf = x
 19
 20    parser = ModelParser(model_xml)
 21    parser.set_parameter_value(topaze_doc.analyses[0].id, "KWKA_RES_PAR",
 22                               {"Type": "FRACTIONAL_DIMENSION", "ZoneIndexX": "1"}, str(delta))
 23    k = np.power(10, k)
 24    internal_perm = services.unit_converter.convert_to_internal(UnitEnum.perm_milli_darcy, k)
 25    parser.set_parameter_value(topaze_doc.analyses[0].id, "KWKA_RES_PAR",
 26                               {"Type": "PERMEABILITY"}, str(internal_perm))
 27    xmf = np.power(10, xmf)
 28    internal_xmf = services.unit_converter.convert_to_internal(UnitEnum.length_feet, xmf)
 29    parser.set_parameter_value(topaze_doc.analyses[0].id, "KWKA_WELL_PAR",
 30                               {"Type": "FRACTURE_XF"}, str(internal_xmf))
 31
 32    # get the updated xml
 33    new_model_xml = parser.export()
 34    result = topaze_doc.set_model_xml(new_model_xml)
 35
 36    if not result.is_success:
 37        services.log.error(result.message)
 38        raise ValueError(f"Document model update has failed: {result.message}")
 39
 40    # retrieve generated data from the document
 41    vectors = topaze_doc.analyses[0].get_plot_data('History')  # <-- need to document plot types
 42    #  NOTE:  dates coming from vectors is not correct because the reference time is often not initialized correctly
 43    for v in vectors:
 44        if v.data_measure == data_measure and v.data_name == historical_name:
 45            data = v.values
 46            data_times = v.elapsed_times
 47        elif v.data_measure == data_measure and v.data_name == simulated_name:
 48            sim = v.values
 49            sim_times = v.elapsed_times
 50
 51    if data is None or sim is None:
 52        raise Exception('No data or simulated data found in the document')
 53
 54    return (data_times, data), (sim_times, sim)
 55
 56
 57def get_ls_residual(x: Tuple[float, float, float], model_xml: str, topaze_doc: Document, data_measure: str, historical_name: str, simulated_name: str) -> npt.NDArray[np.float64]:
 58
 59    (data_times, data), (sim_times, sim) = run_topaze(x, model_xml, topaze_doc, data_measure, historical_name, simulated_name)
 60    sim_interpolator = interp1d(sim_times, sim, bounds_error=False, fill_value='extrapolate')
 61    data_times_array = np.array(data_times)
 62    data_array = np.array(data)
 63    start_match_time = 1000  # started simulation at 1000 hours
 64    diff: npt.NDArray[np.float64] = sim_interpolator(data_times_array[data_times_array > start_match_time]) - data_array[data_times_array > start_match_time]
 65    return diff
 66
 67
 68def perform_least_squares(model_xml: str, topaze_doc: Document, x_init: Tuple[float, float, float], min_vals: npt.NDArray[np.float64], max_vals: npt.NDArray[np.float64], data_measure: str, historical_name: str, simulated_name: str) -> optimize.OptimizeResult:
 69
 70    args_least_squares = [model_xml, topaze_doc, data_measure, historical_name, simulated_name]
 71    result = optimize.least_squares(get_ls_residual, x_init, bounds=(min_vals, max_vals),
 72                                    args=args_least_squares, method='dogbox')
 73    return result
 74
 75
 76services.log.info('[Tutorial 3] Start of user task')
 77data = services.data_enumerator.to_enumerable([cast(UUID, services.parameters.input['Rate']), cast(UUID, services.parameters.input['Pressure'])])
 78services.log.info('[Tutorial 3] Data read by data_enumerator')
 79
 80dates = list()
 81rates = list()
 82pressures = list()
 83times = list()
 84first_date = data[0].date
 85for point in data:
 86    dates.append(point.date)
 87    elapsed = (point.date - first_date).total_seconds() / 60.0 / 60.0
 88    times.append(elapsed)
 89    rates.append(point.values[0])
 90    pressures.append(point.values[1])
 91
 92#  Size of window for smoothing
 93window_size = cast(int, services.parameters.input['Window size'])
 94services.log.info('[Tutorial 4 Smoothing pressure signal for non-zero rate periods')
 95filtered_pressures = utility.filter_positive_values(rates, pressures, window_size)
 96
 97#  Time period for rate decimation
 98delta_t_max = cast(float, services.parameters.input['Time decimation'])
 99
100# # Decimate the rate values by delta_t_max (preserving cumulative production)
101services.log.info('[Tutorial 4] Decimate the rate values by {}'.format(delta_t_max))
102decimated_times, decimated_rates = utility.get_decimated_times_rates(times, rates, delta_t_max)
103
104decimated_dates = list()
105for t in decimated_times:
106    new_date = first_date + datetime.timedelta(hours=t)
107    decimated_dates.append(new_date)
108
109services.log.info('[Tutorial 4] Interpolate pressure')
110pressure_interpolator = interp1d(times, filtered_pressures)
111filtered_pressures = (pressure_interpolator(decimated_times))
112services.data_command_service.replace_data(str(services.parameters.output['Filtered pressure']), decimated_dates, filtered_pressures.tolist())
113
114#  Step data requires the set_first_x method
115services.data_command_service.set_first_x(str(services.parameters.output['Decimated rates']), first_date)
116services.data_command_service.replace_data(str(services.parameters.output['Decimated rates']), decimated_dates[1:], decimated_rates[1:])
117
118services.log.info('[Tutorial 4] Getting Topaze document')
119file_id = services.parameters.input['Topaze file']
120topaze_doc = next(x for x in services.well.documents if (x.type == KWModuleEnum.topaze and x.file_id == str(file_id)))
121
122# Set new pressure and rate values
123ret = topaze_doc.reset_pressure(str(services.parameters.output['Filtered pressure']))
124if not ret.is_success:
125    services.log.error(ret.message)
126ret = topaze_doc.reset_rate(str(services.parameters.output['Decimated rates']), 'OilRate')
127if not ret.is_success:
128    services.log.error(ret.message)
129
130services.log.info('[Tutorial 4] Retrieving model xml')
131# get the model XML once and re-use it on each iteration
132model_xml = topaze_doc.get_model_xml()
133
134services.log.info('[Tutorial 4] Reset delta, k, xmf')
135#  Initial values and min/max bounds
136delta = 0.45
137k = math.log10(1E-4)  # Working in log(k) space
138xmf = math.log10(5000)  # Working in log(Xmf) space
139x_init = (delta, k, xmf)
140min_vals = np.array([0.2, -5, 3])
141max_vals = np.array([0.7, -3, 5])
142
143this_task = services.user_task
144plot_name = 'Regression Summary'
145plot = next((x for x in this_task.plots if x.name == plot_name), None)
146if plot is not None:
147    plot.delete()
148
149pane_name = 'Init vs Final Match'
150summary_plot: Plot = services.user_task.create_plot(plot_name, pane_name)
151
152#  Setting up data for plotting
153data_measure = 'LiquidRateSurface'
154historical_name = 'Decimated rates'
155simulated_name = 'Simulated oil rate'
156(data_times, data_values), (sim_times_init, sim_init) = run_topaze(x_init, model_xml, topaze_doc, data_measure, historical_name, simulated_name)
157date_list = list()
158for x in data_times:
159    new_date = first_date + datetime.timedelta(hours=x)
160    date_list.append(new_date)
161sim_init_list = list()
162for x in sim_times_init:
163    new_date = first_date + datetime.timedelta(hours=x)
164    sim_init_list.append(new_date)
165
166my_data_type = PlotDataTypesEnum.oil_rate_surface
167data_series = summary_plot.add_embedded_data(Vector(date_list, data_values, first_date), 'Data', pane_name, show_symbols=False,
168                                             first_x=first_date, show_lines=True, data_type=my_data_type, is_by_step=True, use_elapsed=False)
169data_series.set_lines_aspect(style=LineAspectEnum.dash)
170init_series = summary_plot.add_embedded_data(Vector(sim_init_list, sim_init, first_date), 'Initial', pane_name, show_symbols=False,
171                                             first_x=first_date, show_lines=True, data_type=my_data_type, is_by_step=True, use_elapsed=False)
172init_series.set_lines_aspect(style=LineAspectEnum.dot)
173
174# # Least squares optimization
175services.log.info('[Tutorial 4] Performing least squares')
176result = perform_least_squares(model_xml, topaze_doc, x_init, min_vals, max_vals, data_measure, historical_name, simulated_name)
177services.log.info('[Tutorial 4] Converged to {}'.format(result.x))
178services.log.info('[Tutorial 4] Rerunning model at optimal point')
179
180# Run final result and add that to plot
181(data_times, data_values), (sim_times_final, sim_final) = run_topaze(result.x, model_xml, topaze_doc, data_measure, historical_name, simulated_name)
182sim_final_list = list()
183for x in sim_times_final:
184    new_date = first_date + datetime.timedelta(hours=x)
185    sim_final_list.append(new_date)
186
187new_final_vector = Vector(sim_final_list, sim_final, first_date)
188final_series = summary_plot.add_embedded_data(new_final_vector, 'Final', pane_name, show_symbols=False, show_lines=True,
189                                              first_x=first_date, data_type=my_data_type, is_by_step=True, use_elapsed=False)
190final_series.set_lines_aspect('Purple', 4, LineAspectEnum.solid)
191
192summary_plot.update_plot()
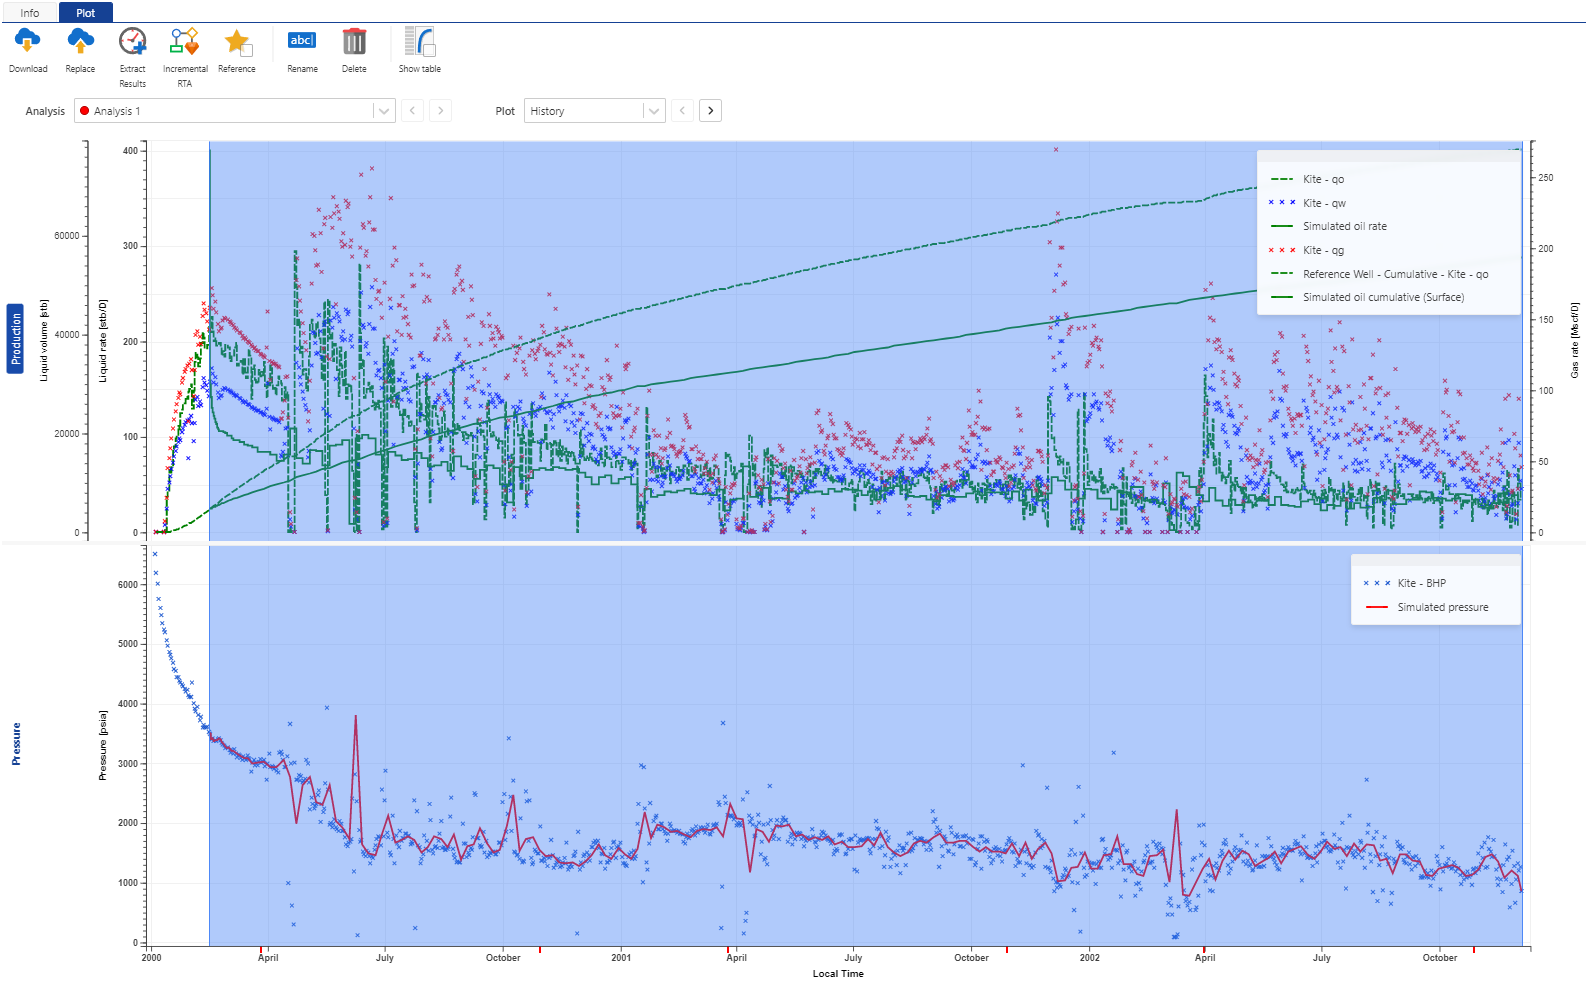
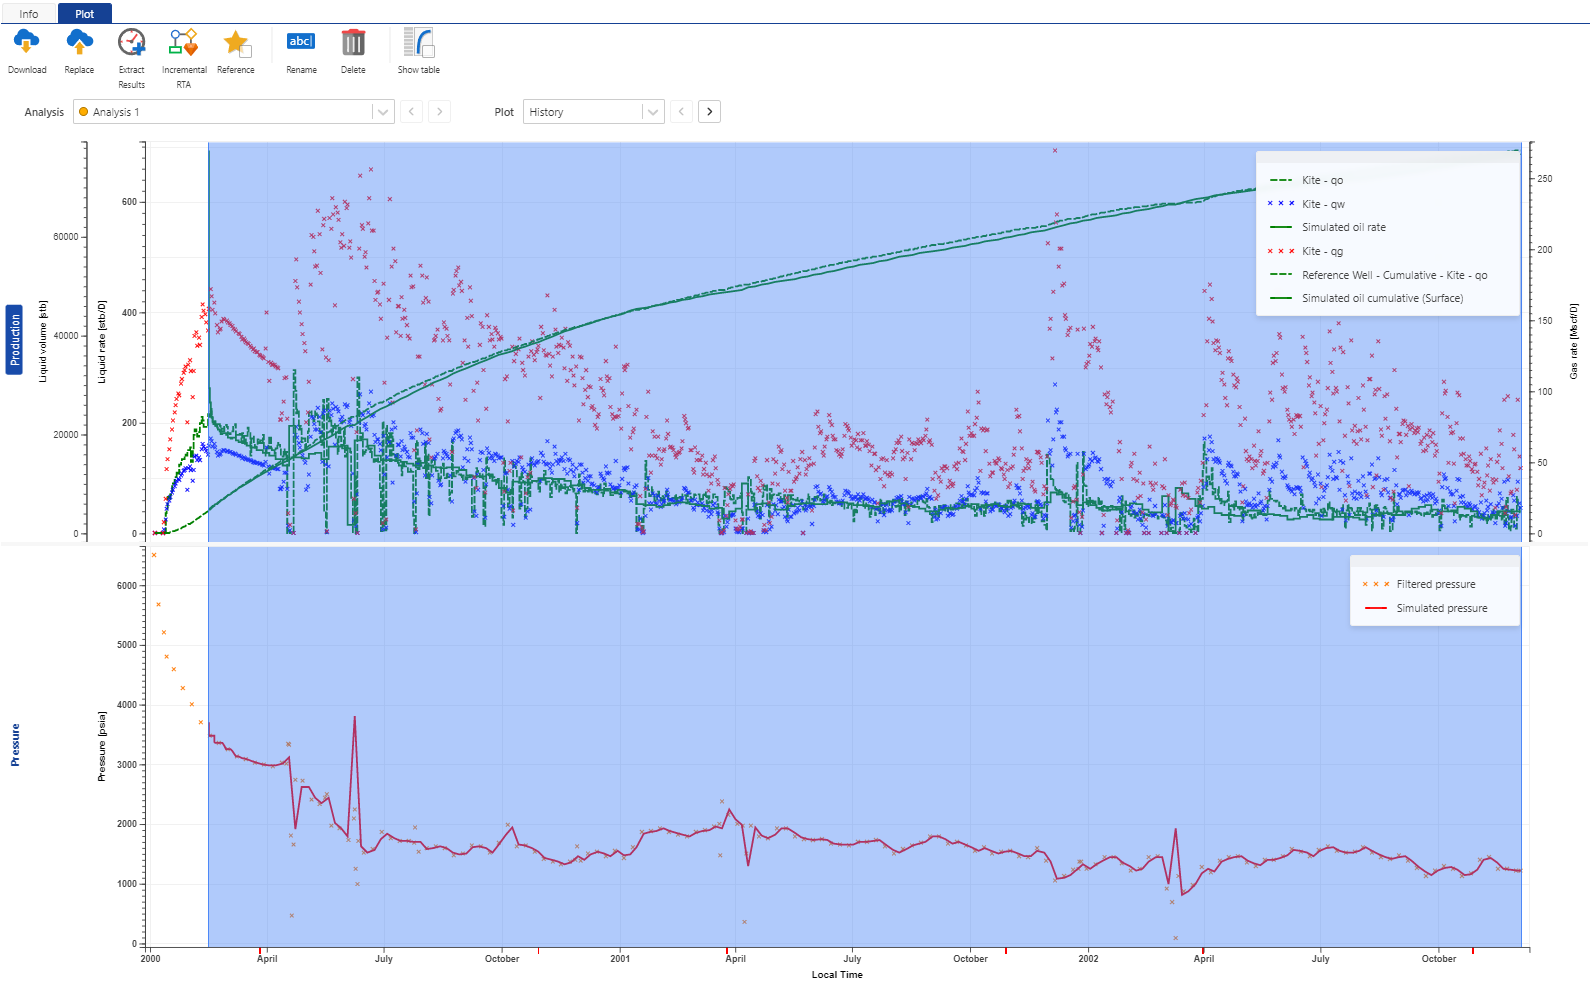
We can see the results of the user task in the before (Fig. 26) and after (Fig. 27) images below.

Fig. 26 The original mismatch of the oil (“Kite - qo”, green dashed line) and simulation results (“Simulated oil rate”, solid green line) before the execution of the user task.#

Fig. 27 The final mismatch of the oil (“Kite - qo”, green dashed line) and simulation results (“Simulated oil rate”, solid green line) after the execution of the user task.#
The simulation file is given below. It is similar to what is found in Tutorial 2, with additional code to initialize the input for the Topaze document.
Click to view the full contents of tutorial_4_simulation.py
 1from kappa_sdk import Connection, KWModuleEnum
 2from kappa_sdk.user_tasks import Context
 3from kappa_sdk.user_tasks.simulation import UserTaskInstance
 4
 5
 6ka_server_address = 'https://your-ka-instance'
 7print('Connecting to {}'.format(ka_server_address))
 8connection = Connection(ka_server_address, verify_ssl=False)
 9
10field_name = 'SPE RTA Demo'
11print("Reading [{}] field data...".format(field_name))
12field = next(x for x in connection.get_fields() if x.name == field_name)
13
14well_name = 'KITE'
15print("Reading [{}] well...".format(well_name))
16well = next(x for x in field.wells if x.name == well_name)
17
18context = Context()
19context.field_id = field.id
20context.well_id = well.id
21
22task = UserTaskInstance(connection, context)
23print("  [->] Well Name = {}".format(task.well.name))
24
25print('[Tutorial 4] Binding parameters..')
26rate_data_type = 'qo'
27rate_name_prefix = 'OIL - '
28rate_data = next(x for x in task.well.data if x.data_type == rate_data_type and x.name.startswith(rate_name_prefix))
29print("  [->] Rate Name = {}".format(rate_data.name))
30task.inputs['Rate'] = rate_data.vector_id
31
32pressure_data_type = 'BHP'
33pressure_name_prefix = 'Calculated'
34pressure_data = next(x for x in task.well.data if x.data_type == pressure_data_type and x.name.startswith(pressure_name_prefix))
35print("  [->] Pressure Name = {}".format(pressure_data.name))
36task.inputs['Pressure'] = pressure_data.vector_id
37
38task.inputs['Window size'] = 21
39task.inputs['Time decimation'] = 168
40
41document_name = 'UR_example.kt5'
42document = next(x for x in task.well.documents if x.type == KWModuleEnum.topaze and (document_name is None or document_name in x.name))
43print('Found {}'.format(document.name))
44task.inputs['Topaze file'] = document.file_id
45
46task.run()

