KAPPA-Automate (K-A) is the next generation response to client requests to move beyond permanent gauge processing, as offered by KAPPA-Server, and integrate automated analysis into customized workflows.
K-A is an infinitely scalable, flexible deployment, Dynamic Data Analysis platform comprising of containerized micro-services.
The open architecture can autonomously handle KAPPA permanent gauge workflows, or it can operate as a transparent satellite to other platforms using open APIs including OSDU compliant structures.
Services and results from KAPPA calculation kernels can be provided seamlessly to third party processes and vice versa.
The first release of K-A replicates and enhances the permanent gauge processing capabilities of KAPPA-Server (K-S) by smart filtering of high frequency data using several alternative filters and automation of pressure transient (PTA) and rate transient analysis (RTA).
KAPPA-Automate Overview
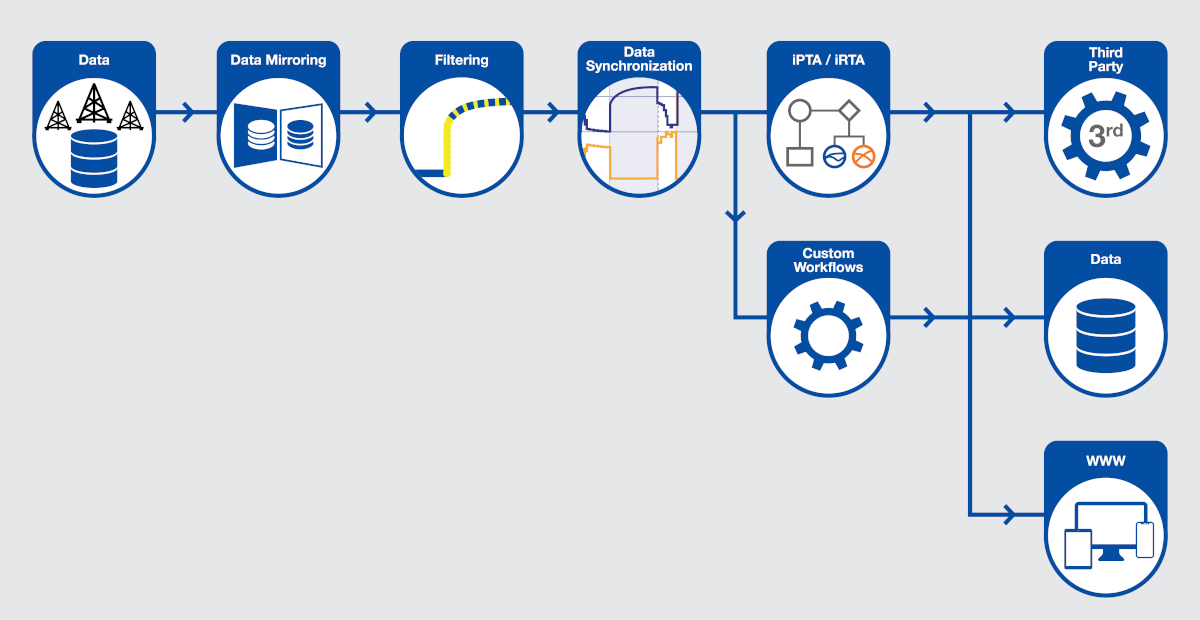
Data Load
Dynamic data is loaded from historians or an external database through the External Data Service.
In K-A v6.10, adaptors exist for Oracle and SQL, PI Web, and Azure Data Explorer.
Once it has caught up with historical data, the external data service will, by default, interrogate the source every two hours for new data.
Hierarchy
The highest-level object is a Field.
A field contains wells, possibly organized into well groups, and can have two types of data: (1) gauges: a time series of any type and (2) well properties, aka well static properties as well as analysis results.
High frequency gauges may be filtered for further processing.
A specific container holds the production rates.
This can also exist as corrected production after synchronization with the pressure and other editing has been performed.
When working with Permanent Downhole Gauge (PDG) data, another channel will indicate shut-ins.
Gauge Attributes
A gauge is typically a mirror of a tag from a historian or database.
A gauge is typed precisely to help automated processes select the correct input.
Besides the data type, a gauge can be recognized and defined as High frequency (HF) or Low Frequency (LF).
The choice will determine the filtering to be applied.
Labels
Labels can be added without restriction to hierarchy objects.
This is another way of enabling later automatic selection.
Files, Folders
Files can be associated to hierarchy elements and organized in folders with possible nesting.
Some file content can be viewed directly in the UI; this applies most importantly to KAPPA-Workstation documents.
Monitoring Mode
Monitoring accesses predefined dashboards to check the platform activity and integrity over the selected period.
PDG Mode
PDG (Permanent Downhole Gauge) is the principal application mode in v6.10.
Fields are created, manipulated and workflows launched.
Automation Mode
Where the data model can be edited, and functions and user tasks created.
The Automation mode can also be used to view and edit the data types and well properties including the path for extraction when mapping KAPPA-Workstation analysis results.
Documents
Documents of any kind, including KAPPA-Workstation documents, can be uploaded. Saphir or Topaze results and main plots may be viewed within the K-A client with analysis results extracted and saved as well properties to track the evolution of parameters with time or to be used in further processes.
Responsive Web Client
The K-A client is launched through a web browser.
The UI is responsive and adapts to the device (PC, tablet, mobile). The top-level screen displays a list of fields, with both search and favorites options.
Languages supported are English, French, Spanish and Chinese.
Tree Mode View
Field elements are represented in the default Tree Mode.
Clicking on any node adapts the working area and displays plots, tables, and additional information.
Flat Views
Designed to view alongside all well properties and create subsets of wells or working sets, well flat view can be used to set values in bulk, or to simultaneously create user tasks for a group of wells.
Data flat view shows all the gauges across the field as a flat list.
It can be used to assign, or simultaneously change, data types and labels for a selected group of gauges.
2D Map
Maps can be created at a well group or field level.
Well properties can be displayed on the map as bubbles with variable size, color or contours.
These may be animated versus time.
Plots
Plots for all elements such as gauges, well properties, filters, task results are available directly.
Custom plots can be created with any number of panes, combining gauges and well properties.
Plot templates, to be used at group or field level, can be created based on data types and labels.
High Frequency Data (Permanent Gauges)
High frequency data are usually stored in the OPCO data historian.
Using preconfigured data links, users can browse the list of available tags (gauges, data sets) in the historian and select those to be mirrored into Automate.
This non-invasive ‘mirroring’ involves copying the data tag from the historian into a gauge item in Automate.
Once done, the gauge item is continuously and automatically updated, mirrored, and filtered.
Low Frequency Data (Permanent Gauges)
Reallocated production data are a good example.
These data can also be mirrored from production databases into KAPPA-Automate and kept automatically updated.
Unlike high frequency data that require filtering, low frequency data are immediately available for analysis, workflows and calculations.
Wavelet Filtering
Data from Permanent Gauges are inherently noisy especially when acquired at high frequency.
Wavelet denoising is used with resampling to reduce data to the minimum to remain meaningful.
K-A runs with default filter parameters (threshold, min dt and max dy) with the user able to visually assess the relevance and override as needed.
Simultaneously, an ‘auto-Filter’ bypasses all the user validation and creates a filter.
There are several wavelet filters in K-A, with or without re-interpolation of data.
There is also a filter dedicated to continuous rate filtering, based on the data integral.
Smart Filtering
Smart filtering reduces the volume of raw data by decimation.
Sections of data exhibiting gradual changes are represented by fewer points while breakpoints or areas with fast changing trends are represented with a greater number of points, resulting in data reduction by two or three orders of magnitude.
Checking Filter Parameters
It is important to verify that the chosen set of filtering parameters (wavelet denoising and smart filtering) are not altering the data to the extent that subsequent analysis are affected.
Filtering quality control can be performed by outputting the actual raw data and using it as a benchmark on a log-log derivative plot in Automate.
The filter threshold values plot should also be checked regularly to ensure that the initially set noise threshold values are adequate to the current noise levels of raw data.
Shut-in Detection
Build-up periods are identified fully automatically using a built-in task or a third-party algorithm.
The algorithm first discriminates sharp upward trends from sharp downward trends.
It then looks for desired sequences and finally refines the starting point.
Inspection of individual shut-ins is possible through a dedicated toolbar.
When a corrected production exists the PTA loglog plots can be visualized directly in the K-A client.
The loglog display triggers, in the background, a dynamic exchange between the UI and the PTA micro-service, which creates a volatile Saphir document on the fly as required.
Rate Correction
Using the shut-in detection information rate data can be automatically corrected and aligned with pressure data.
A rate correction algorithm can also account for the well uptime.
Shut-in QAQC
The quality of results from the automatic shut-in detection algorithm greatly depends on the data quality and sometimes the detection does not give accurate results.
This may be due to the inherent noise in the data or the data shows a soft shut-in.
As best practice, it is always recommended to visually inspect the results of the auto shut-in identification.
Although the algorithm does not require user intervention after it is launched, a validation step can be introduced, that will post process events only after they have been validated.
Incremental Pressure Transient Analysis
The user analyzes a first build-up and drops the resulting Saphir document into Automate as a seed.
The iPTA workflow identifies each new relevant shut-in and applies the same parameters and model as in the seed document to re-run a new analysis.
The iPTA workflow can be run in three ways: (1) extract only (2) extract + model or (3) extract + model + improve.
The first scenario keeps permeability constant and estimates Skin for each shut-in.
The second mode tracks the goodness of fit to decide whether the seed model remains applicable.
In mode 3, the user decides upfront the variables, ranges, etc for the improve.
Documents generated by iPTA are stored in Automate and can be viewed / downloaded.
iPTA can generate one document per shut-in or create up to 10 analyses per document.
All analyses are time-stamped and can be automatically used in other workflows and/or used to trigger alarms to the user.
If the original seed model is no longer valid, users can update the seed model and restart iPTA from a given shut-in, using the updated model.
Incremental Rate Transient Analysis
Similar to iPTA, the iRTA workflow starts with a Topaze document containing a user-generated analysis.
The workflow can then proceed automatically from pressure and possible rate feeds.
When both data sets are available the options are to extract and regenerate the model, or to generate and improve on the complete time range.
When only pressure is available, rates will be generated in Virtual Meter mode.
The iRTA workflow continuously updates the Topaze document. The simulated rate, cumulative, and possibly pressure, are written back under the parent well.
An important assumption of iRTA is that the well is not subject to nearby well interference.
Functions
Functions are the easiest way to add processing to the default K-A capabilities.
Simple function definitions can be created by typing an equation and defining the input types.
Labels can be used to further direct the binding.
User Tasks
This is a powerful means of adding functionality to K-A.
Supporting development in Python.
For the latter, a SDK provides simplified access to the platform APIs.
The SDK can also be used to develop and run code locally, and then migrate this into a user task in K-A to be executed by the platform automatically on selected triggers.
REST APIs
Extending the platform capabilities or consuming platform data and services can be done by directly calling the REST APIs of the platform services outside the user task framework.
KAPPA-Workstation Integration
A field structure can be opened from the K-W browser providing the ability to drag and drop data from K-A to K-W.
Once data is dropped in a K-W document, the link is retained, and subsequent updates can be made.
K-Server as a Data Source
When a K-S installation exists, a data service can turn the K-S repository into a data source for K-A.
When creating a K-A gauge, it is then possible to drill down into the K-S fields and data to select any desired tag.
K-Server to K-Automate
Seamless migration of fields from K-S to K-A is through the installation of an export service in K-A.
This generates a complete description of the objects of a field in a structured XML file.
A migration utility then calls this service and uses K-A APIs to recreate all the necessary objects, data and links to enable the migration.