Monitoring your Kubernetes Cluster (via Grafana Dashboards)
This dashboard provides a view of both health and resources utilization within your Kubernetes cluster. With the Kubernetes Overview both K8s and VMs you have the capability to monitor deployments while identifying potential problems.
Filtering Dashboards
The dashboard includes several filtering options to help you customize your view:

(1) Data Source | (5) Time Range |
(2) Node(s) | (6) Time Range Zoom Out |
(3) Namespace | (7) Refresh |
(4) Share | (8) Auto Refresh |
In the following sections, you can learn more about different Grafana dashboards and monitoring solutions available for your Kubernetes cluster.
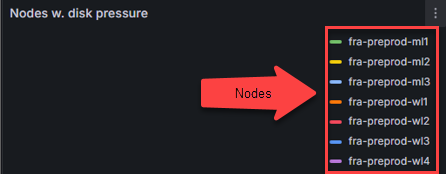
Nodes with disk pressure
Nodes with disk pressure – identifies nodes running low on disk space. Can be used to identify the following issues:
Failed storage devices
Poorly configured persistent volumes
Pod eviction
Scheduling issues
Solutions for disk pressure issues:
Remove unused files, logs, temporary data from the affected node
Verify affected pod has adequate request and resource limits
Resize persistent volumes
Use node affinity rules to distribute storage-heavy workloads across nodes
The ellipsis on dashboard provides additional options to interact and manage dashboards:
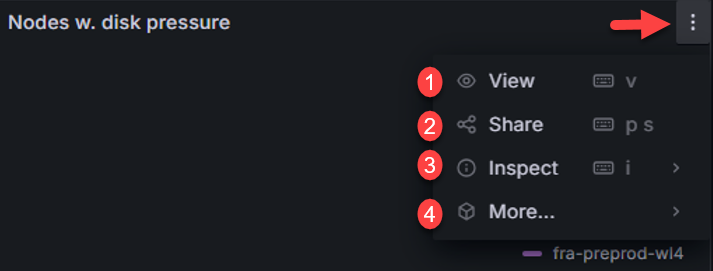
(1) View – maximize dashboard
(2) Share - share options
(3) Inspect – export data, JSON, query request, query performance, raw data
(4) More – hide legend
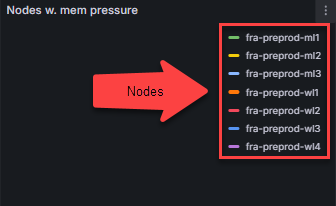
Nodes with memory pressure
Nodes with memory pressure – identifies nodes running low on memory. Can be used to identify the following issues:
Insufficient application performance
Latency
Pod eviction
Unstable nodes
Solutions for memory pressure issues:
Verify affected pod has adequate request and resource limits
Delete and recreate pod
Increase node memory
Scale cluster by adding more nodes
The ellipsis on dashboard provides additional options to interact and manage dashboards:
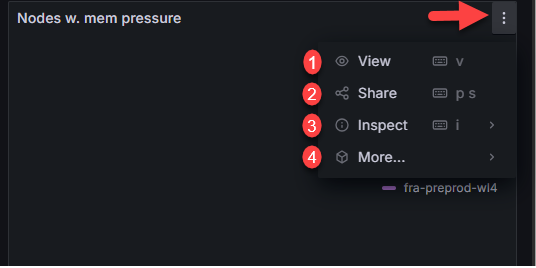
(1) View – maximize dashboard
(2) Share - share options
(3) Inspect – export data, JSON, query request, query performance, raw data
(4) More – hide legend
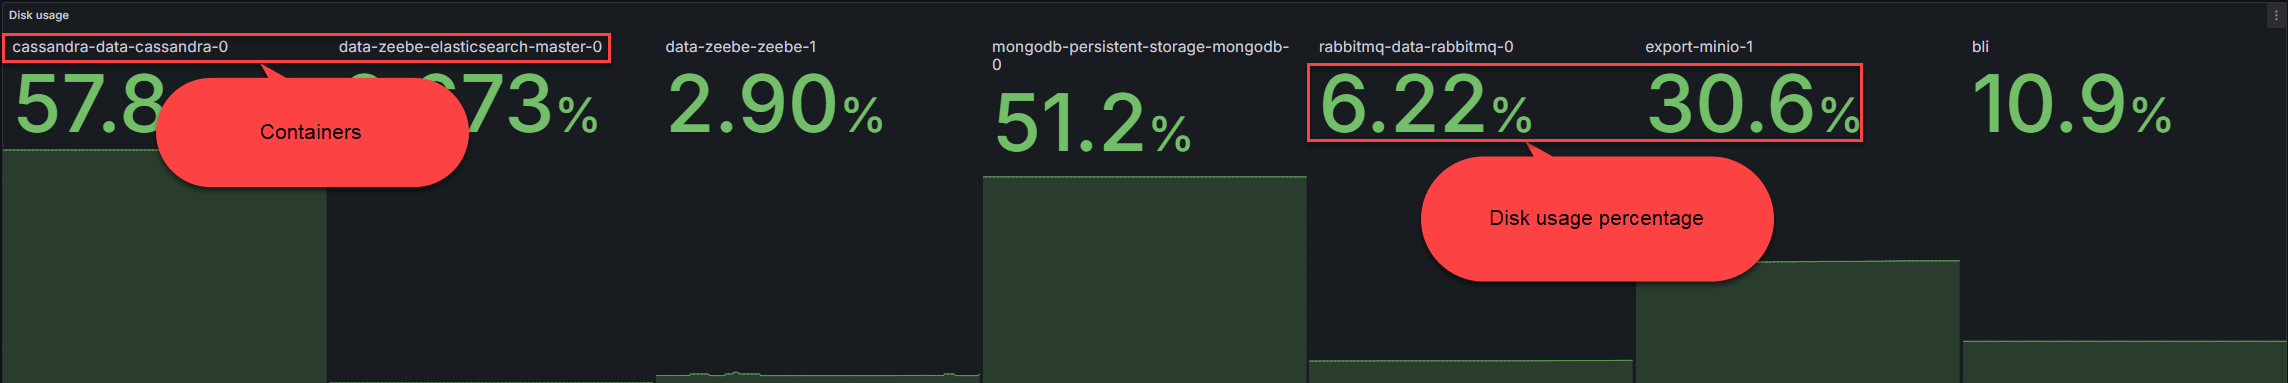
Disk usage
Disk usage – the amount of disk usage in each node and application. It can be used to identify the following:
Available disk space
Disk pressure
Excessive data storage
Premature disk fill
Solutions for disk usage issues:
Verify affected pod has adequate request and resource limits
Add more disk space
Set resource quota to limit storage used by containers within namespace
The ellipsis on dashboard provides additional options to interact and manage dashboards:
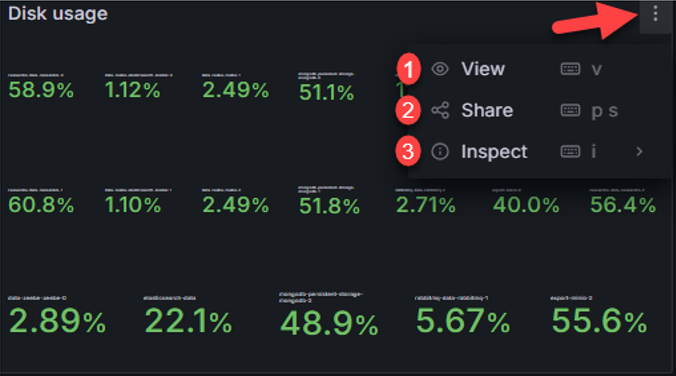
(1) View – maximize dashboard
(2) Share - share options
(3) Inspect – export data, JSON, query request, query performance, raw data
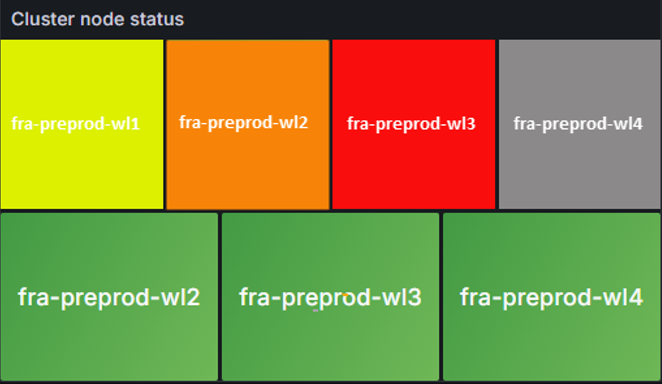
Cluster node status
Cluster node status – provides overall health of nodes and metrics. Color state can identify the following:
Gray – metric or node in unknown state and/or not reporting
Green – Healthy node and metrics are healthy
Yellow/Orange – warning that node is experiencing issue but not critical
Red – node in critical state requiring immediate attention
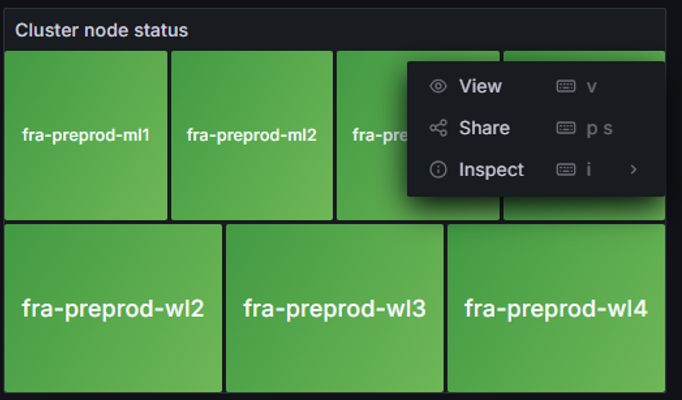
The ellipsis on dashboard provides additional options to interact and manage dashboards:
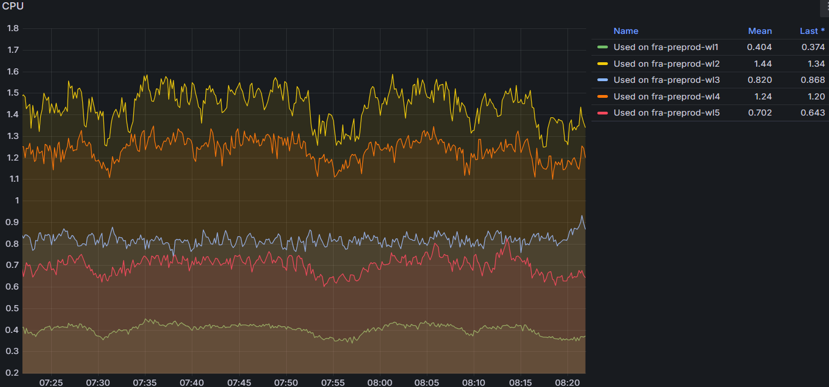
CPU
CPU - monitors CPU usage for each node and metrics of load average, throttling, and idle time. Can Identify the following:
Anomaly detection
Resource optimization
CPU throttling
CPU Spikes
Solutions for CPU issues:
Check metrics, logs, and traces to identify patterns
Increase resource requests and limits for containers
Optimize resources by identifying nodes under or over-utilized; reallocate resources
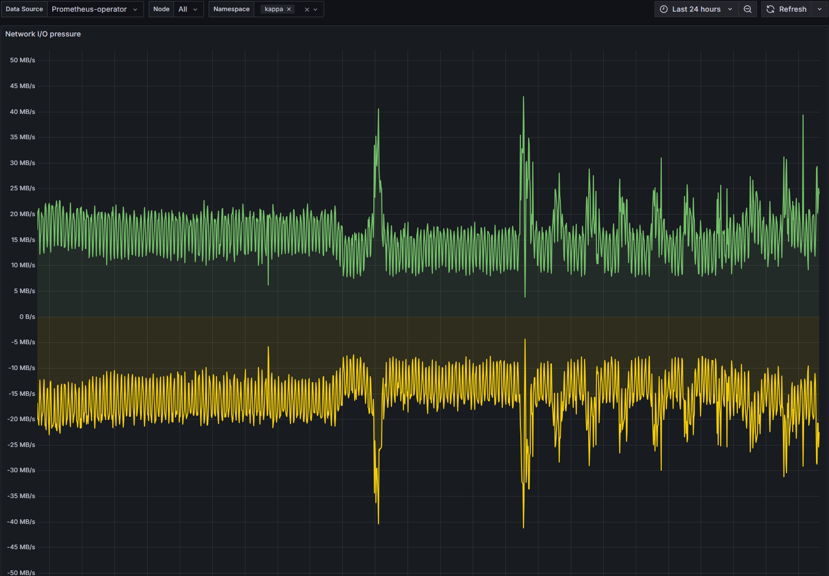
Network I/O pressure
Network I/O pressure – monitors health and performance of network. Can be used to identify the following:
Anomalies (spikes and/or drops)
Bottlenecks
Network Congestion
Overutilization
Solutions for Network I/O issues:
Redistribute workload to alleviate pressure
Implement traffic shaping to prioritize critical network traffic
Increase bandwidth or add more nodes to distribute load
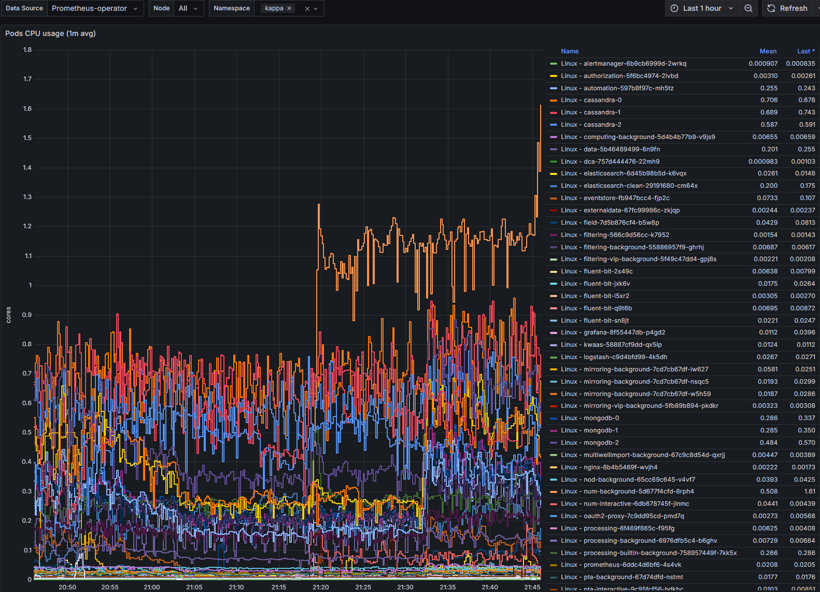
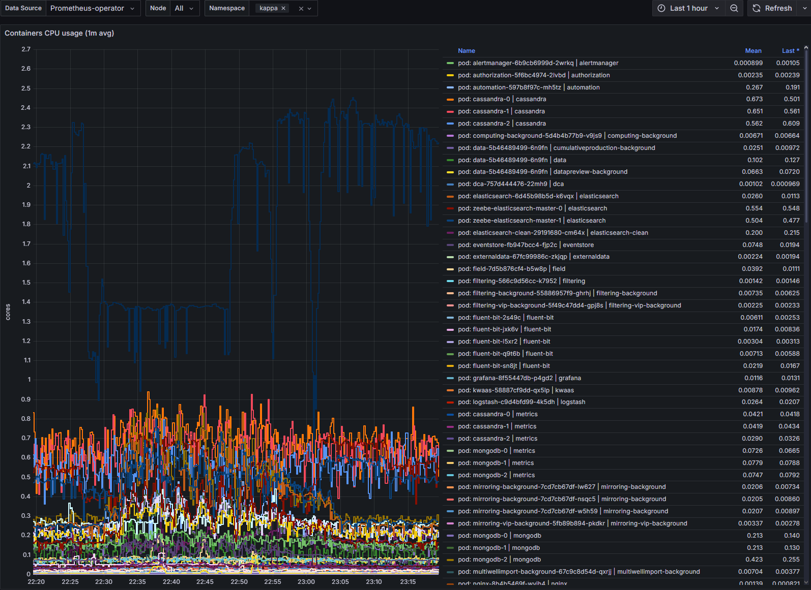
Pods CPU usage
Pods CPU usage - monitors CPU usage of all pods and services running in nodes. Can be used to identify the following:
Anomalies (spikes and/or drops)
CPU Throttling
Scaling needs
Resource utilization
Solutions for Pod CPU issues:
Set adequate CPU limits and requests
Implement Vertical Pod Scaling or Horizontal Pod Scaling
Monitor CPU usage with threshold limited alerts
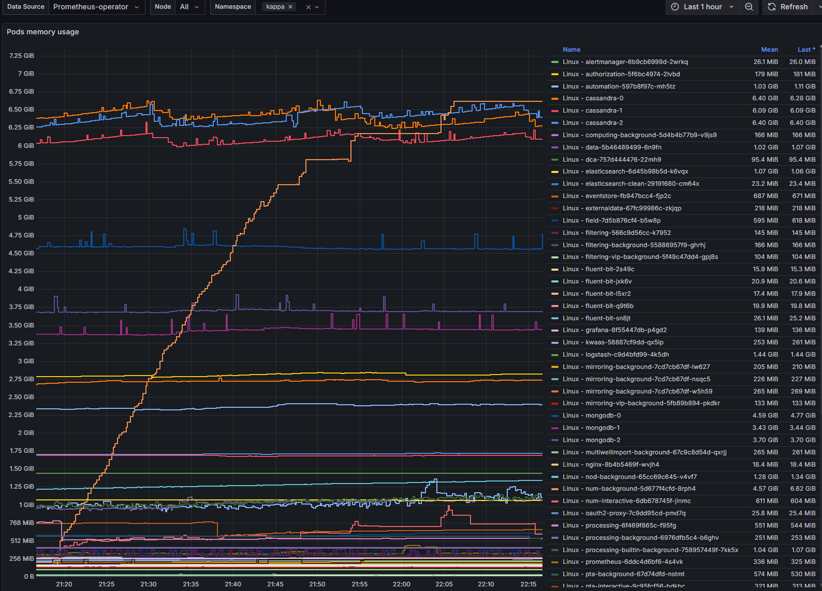
Pod memory usage
Pod memory usage – provides real-time metrics of nodes memory consumption. Can be used to identify the following:
Bottlenecks
Memory leaks
Performance
Resource inefficiencies
Solutions for Pod memory issues:
Set adequate memory limits and requests
Implement Vertical Pod Scaling
Monitor memory usage with threshold limited alerts
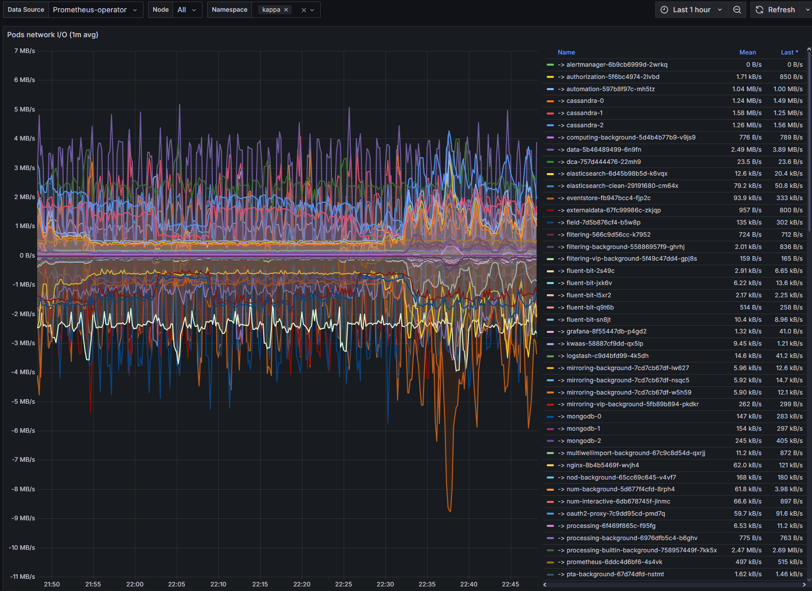
Pods network I/O
Pods network I/O – monitors the amount of inbound and outbound network traffic of each pod.
Congestions
Data transmission delays
DNS failures
Intermittent timeouts
Solutions for Network I/O issues:
Set adequate CPU/memory request to avoid throttling
Implement traffic shaping to prioritize critical network traffic
Check DNS, service endpoints, and network policies
Check for node pressure or pod restarts
Container CPU usage
Container CPU usage – CPU metrics of containers within nodes. Can identify the following:
High CPU usage
CPU throttling
Over/Under-provisioning
Solutions for Container CPU usage issues:
Set adequate CPU limits and request
Implement Vertical Pod Scaling or Horizontal Pod Scaling
Monitor CPU usage with threshold limited alerts
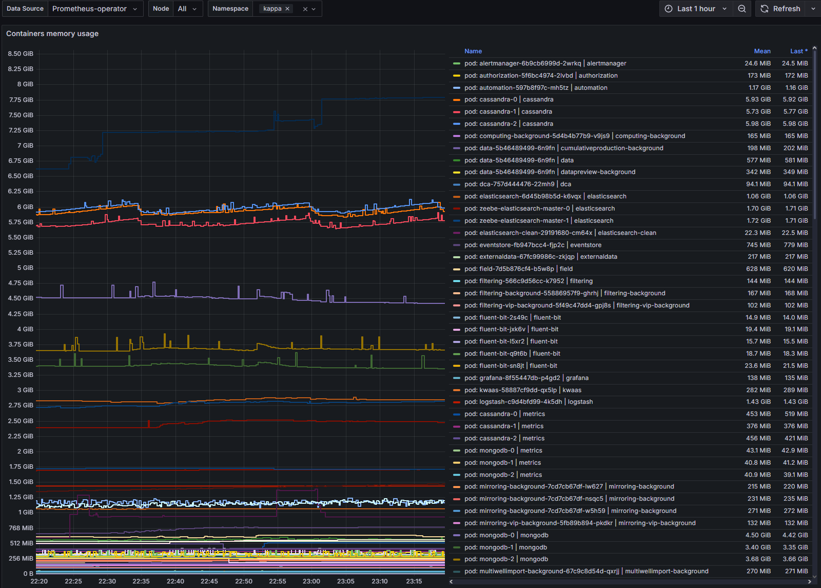
Container memory usage
Container memory usage – metric display of memory usage by containers within nodes. Can be used to identify the following:
Memory leaks
Memory pressure
Container intermitted restarts
Poor application performance
Solutions for Container memory usage issues:
Set adequate CPU limits and request
Implement Vertical Pod Scaling
Monitor memory usage with threshold limited alerts
Monitor to identify trends and sustained high usage
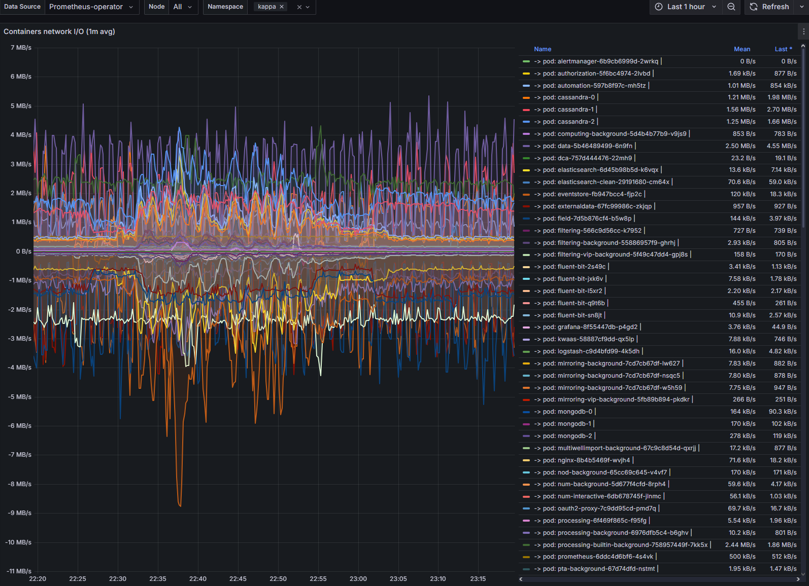
Container network I/O
Container network I/O - provide visual of container network input and output metrics.
Latency
Data flow restrictions
Traffic patterns
Solutions for container network I/O issues:
Set adequate CPU/memory request to avoid throttling
Set bandwidth limits
Check DNS, service endpoints, and network policies
Check for node pressure or pod restarts
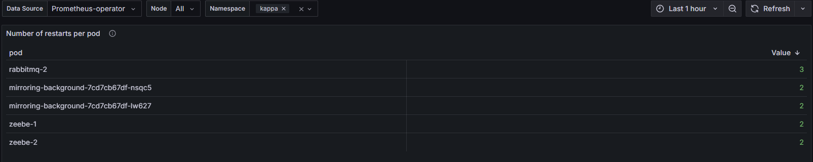
Number of restarts per pod
Number of restarts per pod – displays number of restarts by pods. Issues it could identify the following:
Container fails to start successfully
Memory limit exceeded
Network timeouts
Unhandled exceptions or failed dependencies
Solutions for pod restarts:
Modify CPU/memory requests and limits
Check Pod events and logs
Check DNS, service endpoints, and network policies
Verify dependencies are reachable
Scenarios
Common Kubernetes Scenarios
Kubernetes issues that may occur along with course of action to provide solution
Scenario | Course of Action |
|---|---|
Developer can't access the cluster | Check kubeconfig and RBAC roles |
Pod is stuck in CrashLoopBackOff | View logs, restart pod, escalate if needed |
Service is unreachable | Verify service and pod endpoints |
Namespace quota exceeded | Adjust limits or advise user |
App deployment failed | Check Helm release status and logs |
Common Pod Networking Scenarios
Kubernetes issues that may occur along with course of action to provide solution
Scenario | Course of Action |
|---|---|
Pod can't reach service | Check DNS, service endpoints, and network policies |
High latency | Monitor bandwidth, check node load, inspect CNI |
DNS failures | Restart CoreDNS, check config maps |
Intermittent timeouts | Look for node pressure, CNI restarts, or pod restarts |
Common Container CPU usage Scenarios
Kubernetes issues that may occur along with course of action to provide solution
Scenario | Course of Action |
|---|---|
High CPU usage | Profile app, increase CPU requests, use HPA |
CPU throttling | Increase CPU limits or remove them |
Pod evicted due to CPU | Spread workloads, use node affinity |
Uneven CPU usage | Balance requests across pods |
Common Container memory usage Scenarios
Kubernetes issues that may occur along with course of action to provide solution
Scenario | Course of Action |
|---|---|
Pod is OOMKilled | Increase memory limit, check logs for cause |
Memory usage keeps growing | Profile app for leaks, restart periodically |
Node memory pressure | Spread pods across nodes, use affinity rules |
App crashes under load | Use HPA/VPA, increase memory requests |