Consistency check
Objectives
The objective of the task is to compare each shut-in with a reference one. The result of the comparison is the consistency between the two shut-ins along with permeability and skin changes between the reference and the current shut-in.
The consistency value is a measure of the distance on the loglog plot between the reference shut-in and the current shut-in, after it has been translated to provide a best fit to the reference shut-in. A perfect fit between the curves results in a consistency of 1. As the fit becomes worse, the consistency value decreases.
In addition the task creates loglog plots with derivatives comparison for each shut-in. The plots allow an engineer to evaluate the quality of the curves matching.
Theory
About the curves translation and permeability multiplier
From type curve matching theory it is known that actual data curves (both dp and p’) have exactly the same shape on loglog plot as the dimensionless theoretical solution provided the data correspond to the model. The dimensional and dimensionless curves are shifted by constants relative to each other. The ordinates are shifted by the amount of and the abscissas are shifted by the amount of .
From the above it is evident that if we have two situations with different permeabilities, and , and other parameters being equal, the corresponding log curves will be shifted diagonally relatively to each other.
If , then the curves are shifted by the amount of both horizontally and vertically.
About the distance in regression cost function and consistency
The goal of the regression in the user task is to find a permeability multiplier that provides the best overlay of the curve with the reference one. The best overlay is equivalent to the minimum distance and maximum consistency between the two curves.
There are two possible options in the user task, viz. vertical distance consistency check and diagonal distance consistency check.
The vertical distance consistency check is based on the classical formula of vertical distance (Lp norm with p=0.5 to account for outliers):
where:
N is number of points in reference curve above a minimum time designed to remove early time behavior,
y ref is either Δp’ or log(Δp’) (user choice) of the reference shut-in curve above ,
y is either Δp’ or log(Δp’) (the user choice) of the translated shut-in curve (reference rate normalized) above ; the values are interpolated to the times of the reference curve.
This approach works well in cases where two curves have similar shapes. However, if the curves are different due to noisy data or different flow regimes in early or/and late data the above approach can fail, often due to the inability to consistently define a .
The alternative approach uses a diagonal distance that is consistent with the diagonal shift of a curve. Outliers, characterized as either noise or different flow regimes/behaviors, are accounted for in two manners. First, weights associated with each point in the loglog curve are calculated by comparing the gradients of the loglog curves at the intersection with the reference curve in the diagonal direction (see below, right). Similar gradients will have higher weights, as determined by the dot-product. Second, an iterative weighted least squares approach performs multiple regressions and employs a special arctan cost function which removes the effect of outliers. This approach does not require the definition of .
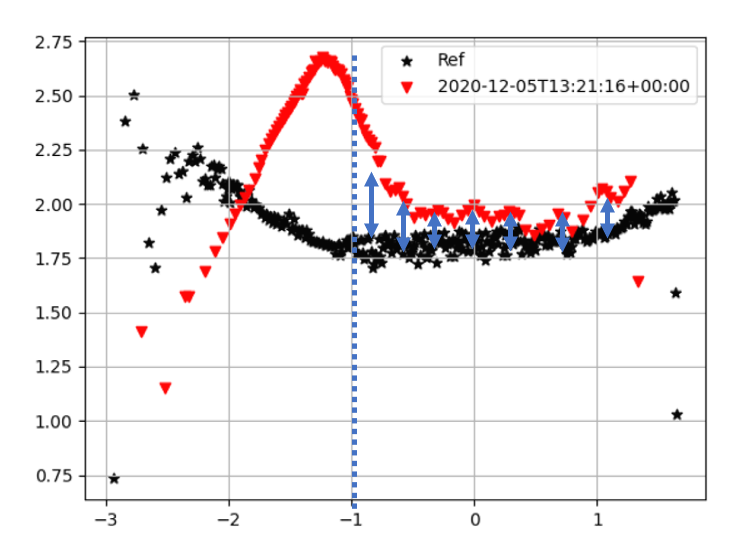
Vertical distance
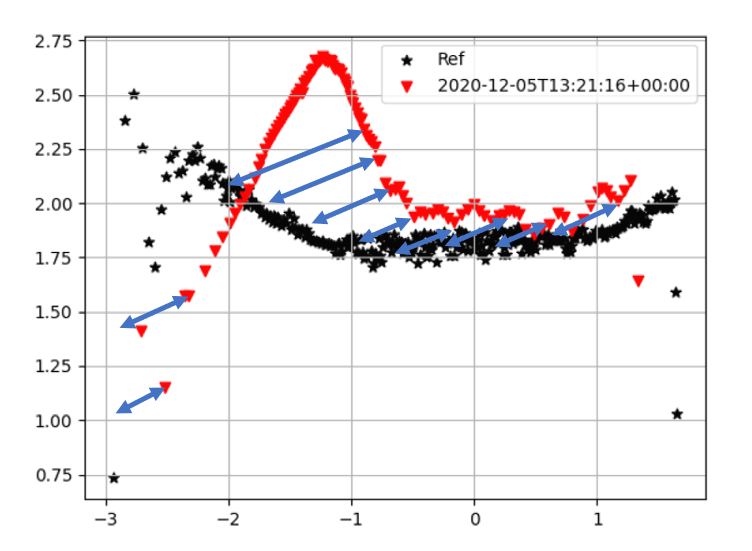
Diagonal distance (diagonal means slope 1 on loglog)
Consistency is a function of the distance after translation. The smaller the distance the better the consistency. Identical curves would result in a value of 1. Lower values imply a greater distance and hence less consistency.
Calculating skin change
When the best fit is obtained the skin change is calculated by the following formula:
The pressure values are calculated at for vertical distance approach, at an input time for the diagonal distance approach.
Input
Data Type – type of the pressure data used for derivative extraction, P or BHP; the selection allows to reduce the number of suggested channels for ‘Pressure’ parameter below.
Reference document (optional) – Saphir file with PVT data; the document may include one or more analyses, with the first analysis used as a reference.
Override Reference Shut-in – available when no reference document is selected. If checked, the reference shut-in set on the dashboard is overridden by the one selected through the "Reference shut-in" input.
Reference Shut-in – available when ‘Override Reference Shut-in’ is selected. Number of the shut-in used as a reference.
Pressure – pressure gauge used for the pressure derivative extraction.
Shut-in Dataset – the shut-in channel that is used for shut-in extractions. It is recommended to select the same shut-in channel that was used for the corrected production.
OilRate, GasRate, WaterRate (optional) – corrected rates. Although the parameters are optional, at least one rate channel is required for the shut-in extractions. If two or three phases are selected, the reference document is obligatory; PVT information from the document is used to calculate total rate.
Minimum shut-in duration – the parameter is used to screen out short shut-ins.
Minimum time to discard early time data – minimum time below which data will be excluded from the regression calculations. Only data later than this time are used for the best fit search. This parameter is only required when employing the vertical distance (default) calculation and also used for the skin change calculation.
Use log (dp’) in objective function – if checked, the distance between the derivatives is calculated in log-scale, otherwise the distance is measured in dp’.
Use diagonal consistency check – if checked, diagonal distance with a weighting is used for the regression and consistency value calculation; the diagonal distance is designed to lessen the influence of dissimilar sections of the derivatives.
Time for skin change calculation – available when diagonal consistency check is used. This time value is used for skin change calculation.
Consistency cut-off (optional) – a value to exclude calculation results from the output; only results for shut-ins with consistency values above this threshold are shown.
Output
Consistency – dataset with consistency values recorded at the shut-in start times.
Permeability multiplier – dataset with reference permeability multipliers recorded at the shut-in start times.
Skin change– dataset with skin change values recorded at the shut-in start times.
Permeability – dataset with permeability values recorded at the shut-in times; the dataset appears only if a reference document is selected and there are analysis results; the values are calculated from the reference permeability and the permeability multipliers.
Skin – dataset with skin values recorded at the shut-in times; the dataset appears only if a reference document is selected and there are analysis results; the values are calculated from the reference skin and the skin change values.
Loglog plots with reference shut-in derivative, current shut-in derivative and best fit (shifted) current shut-in derivative.
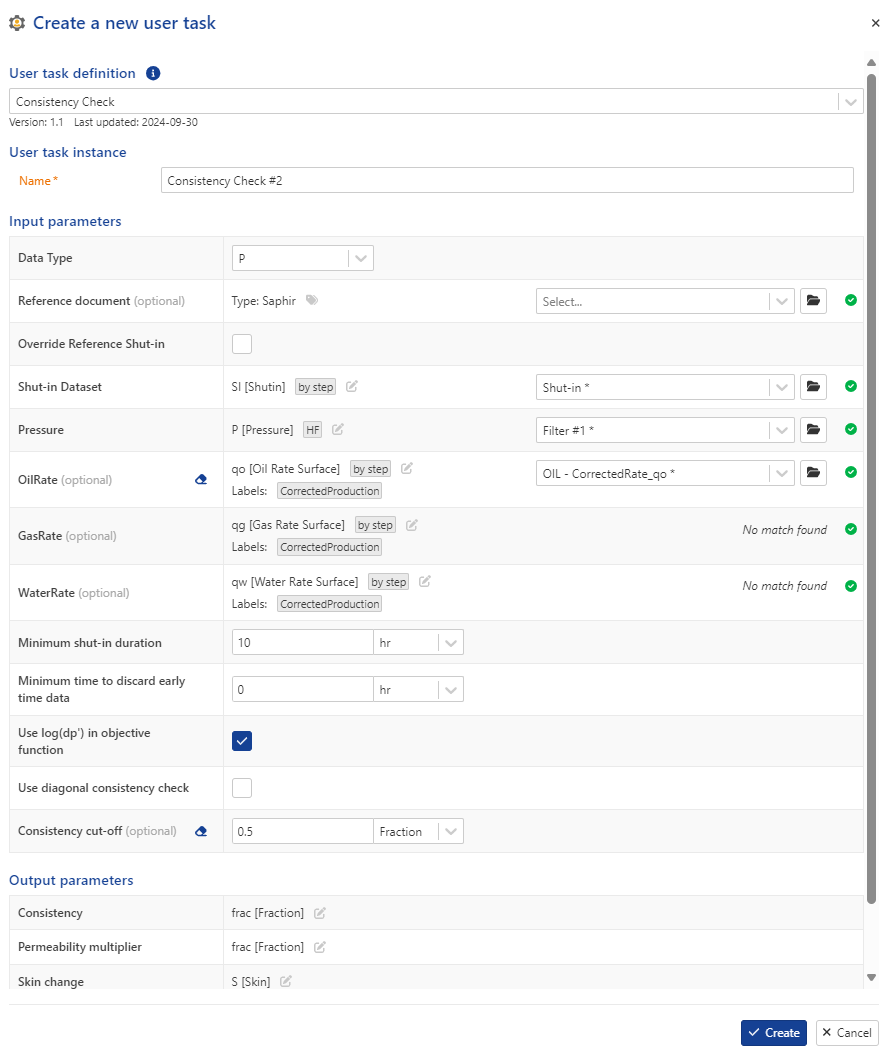
User Task dialog
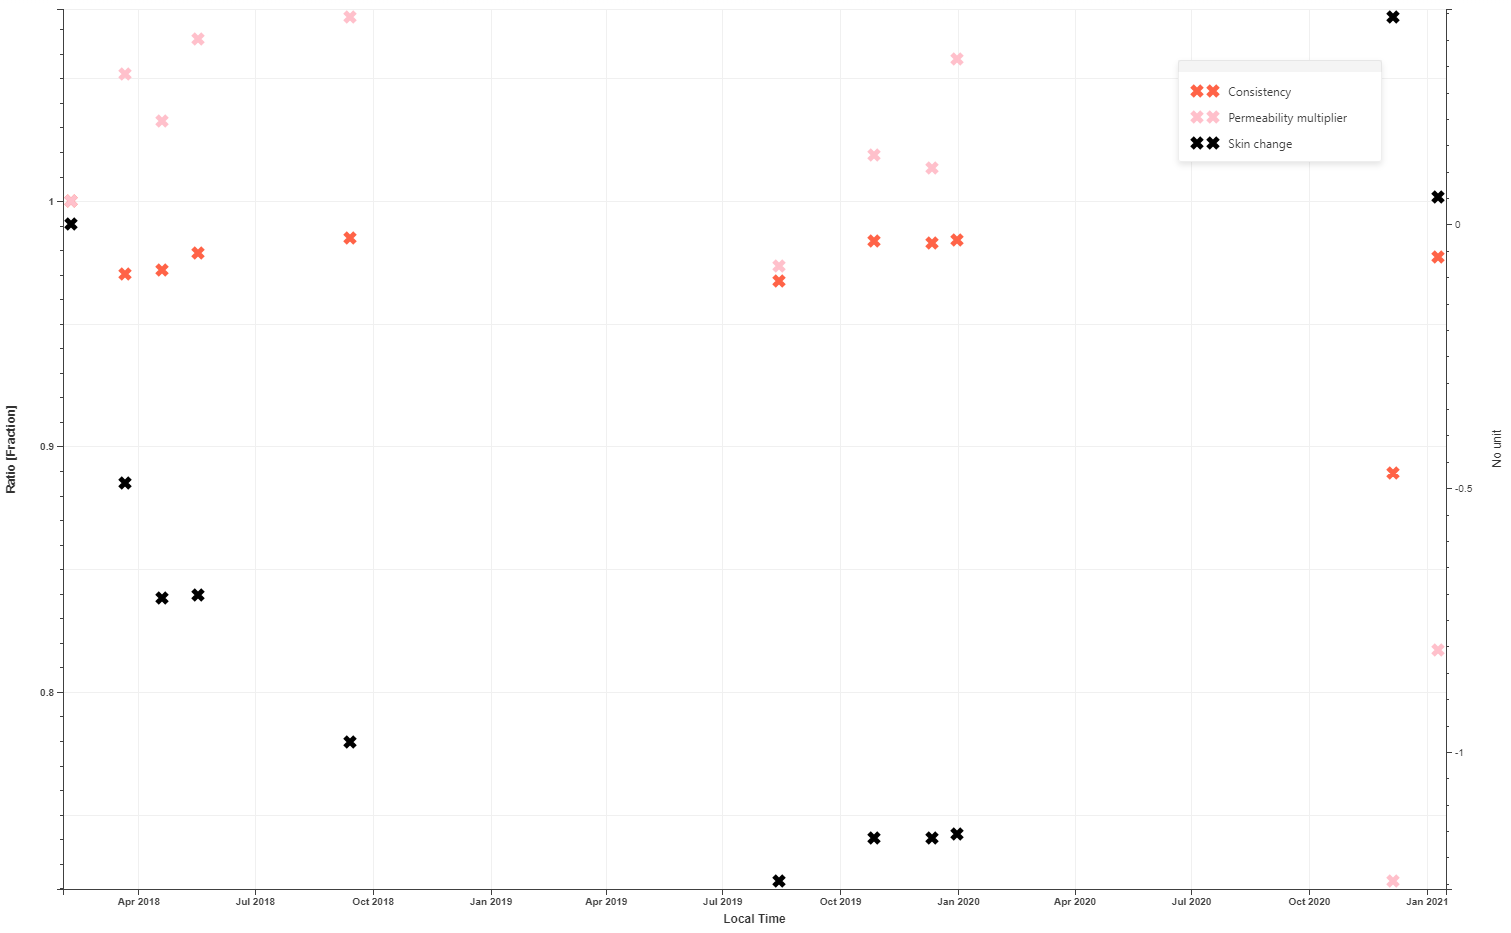
Output channels (no reference document option)
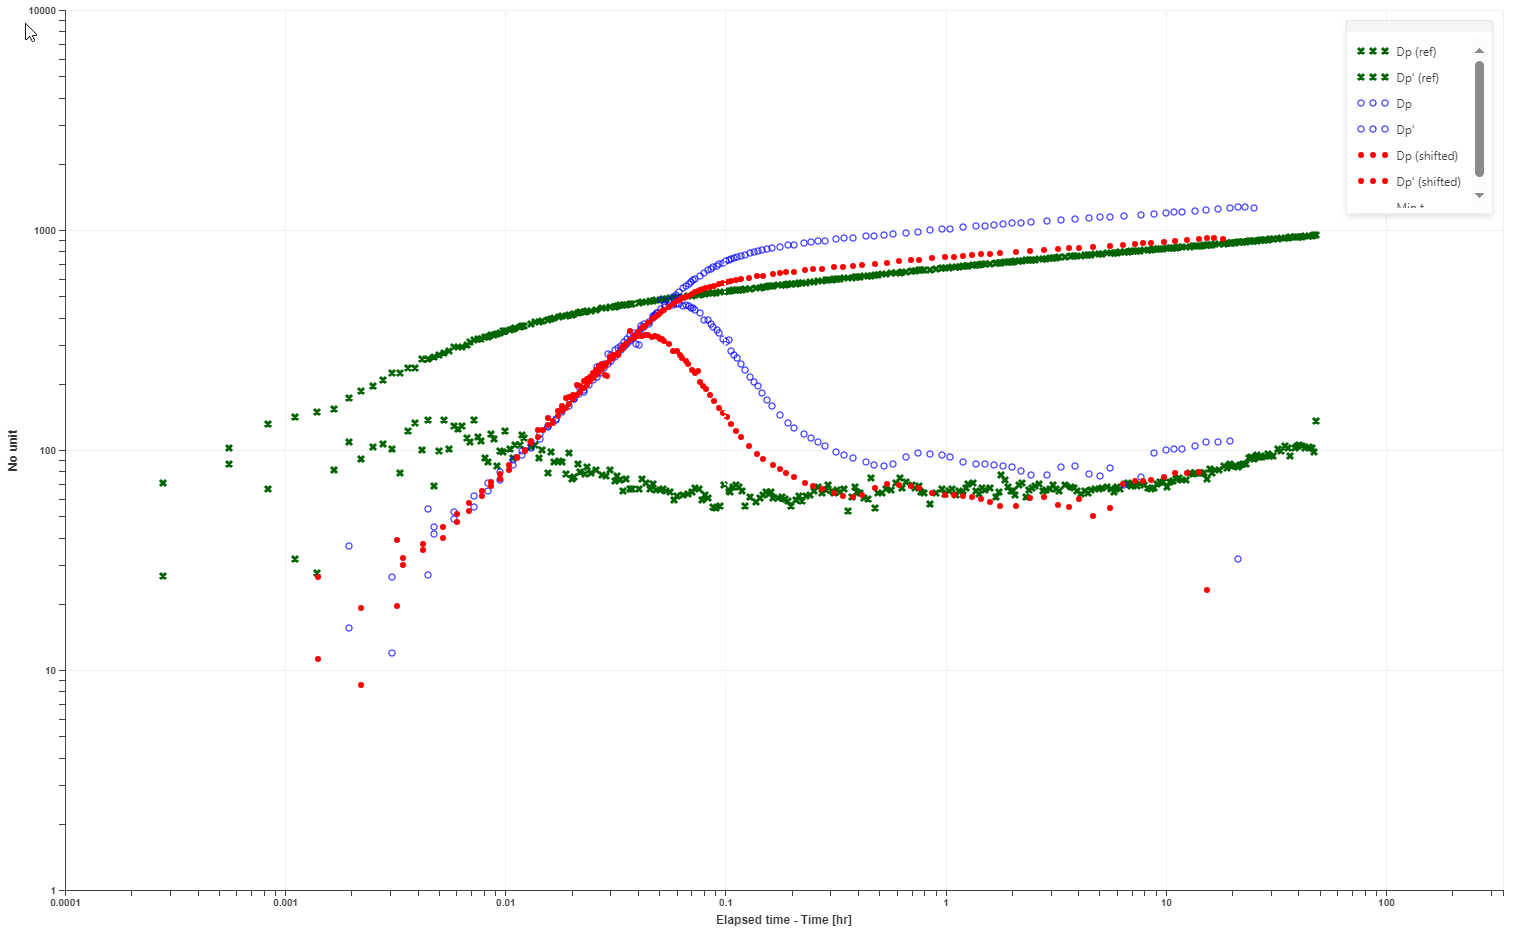
Loglog comparison, where reference shut-in (highlighted in green), current shut-in (highlighted in blue), and best-fit current shut-in (highlighted in red) are all normalized by the reference rate.