Maps
Maps can be created at a well group or field level. Well properties can be displayed in the map as bubbles (size or color) or contours. Animation through time is possible.
 |
Working with Maps
Creating a 2D Map
Select the field node in the field hierarchy.
Click on Map,
 , in the options at the top under the Info tab.
Enter the map name.
Click on Create.
Note
Multiple maps can be created for a given field.
Renaming a 2D map
Select the map in the field hierarchy.
Click on Rename,
 , among the options at the top of the map.
Or,
Right click on the map in the field hierarchy.
Select Rename.
Deleting a 2D map
Select the map in the field hierarchy.
Click on Delete,
 , among the options at the top of the map.
Or,
Right click on the map in the field hierarchy.
Select Delete.
Or,
Select the Maps (parent) node in the field hierarchy.
Go to the Children tab.
Select the maps to delete.
Click on Delete,
.
Editing Map Objects
Drawing a Contour on the Map
Select the map in the field hierarchy.
Click on Contour,
 , among the options at the top of the map.
With the contour edit mode on, click anywhere on the map to add the first node.
Move the cursor to a new location to add another node.
A line segment connecting the two nodes is automatically created.
Continue this process till all the nodes are drawn.
Complete the polygon with a double click at the last node.
Multiple contours can be drawn on the map.
Drawing a Fault on the Map
Select the map in the field hierarchy.
Click on Fault,
 , among the options at the top of the map.
With the fault edit mode on, click anywhere on the map to add the first node.
Move the cursor to a new location to add another node.
A line segment connecting the two nodes is automatically created.
Continue this process till all the nodes are drawn.
Complete the fault definition with a double click at the last node.
Multiple faults can be drawn on the map.
Editing a Contour / Fault on the Map
Select the map in the field hierarchy.
Click on Edit,
 , among the options at the top of the map.
With the edit mode on, click on the fault or contour to edit.
All the nodes of the selected object will be visible:
Click and move the nodes as needed to edit the contour/fault.
Once done, click on Edit again to exit the edit mode.
Click on Save,
 , to commit the changes or Discard,
  , to reject them.
Loading a Shape File to the Map
Select the map in the field hierarchy.
Click on Shape file,
 , among the options at the top of the map.
Select the shape file to load.
Click on Open.
Loading a Georeferenced Image on the Map
Select the map in the field hierarchy.
Click on Image,
 , among the options at the top of the map.
Select the image (.png, .jpg, .jpeg formats) and associated world file (.pgw, .jgw, .tfw, .gfw, .wld formats) to load.
Optional. Specify the Coordinate Reference System (it supports UTM Zone, Pseudo Mercator and WKT).
Validate with OK.
Showing / Hiding Objects on the Map
With the map selected, click on
 in the toolbar on the right.
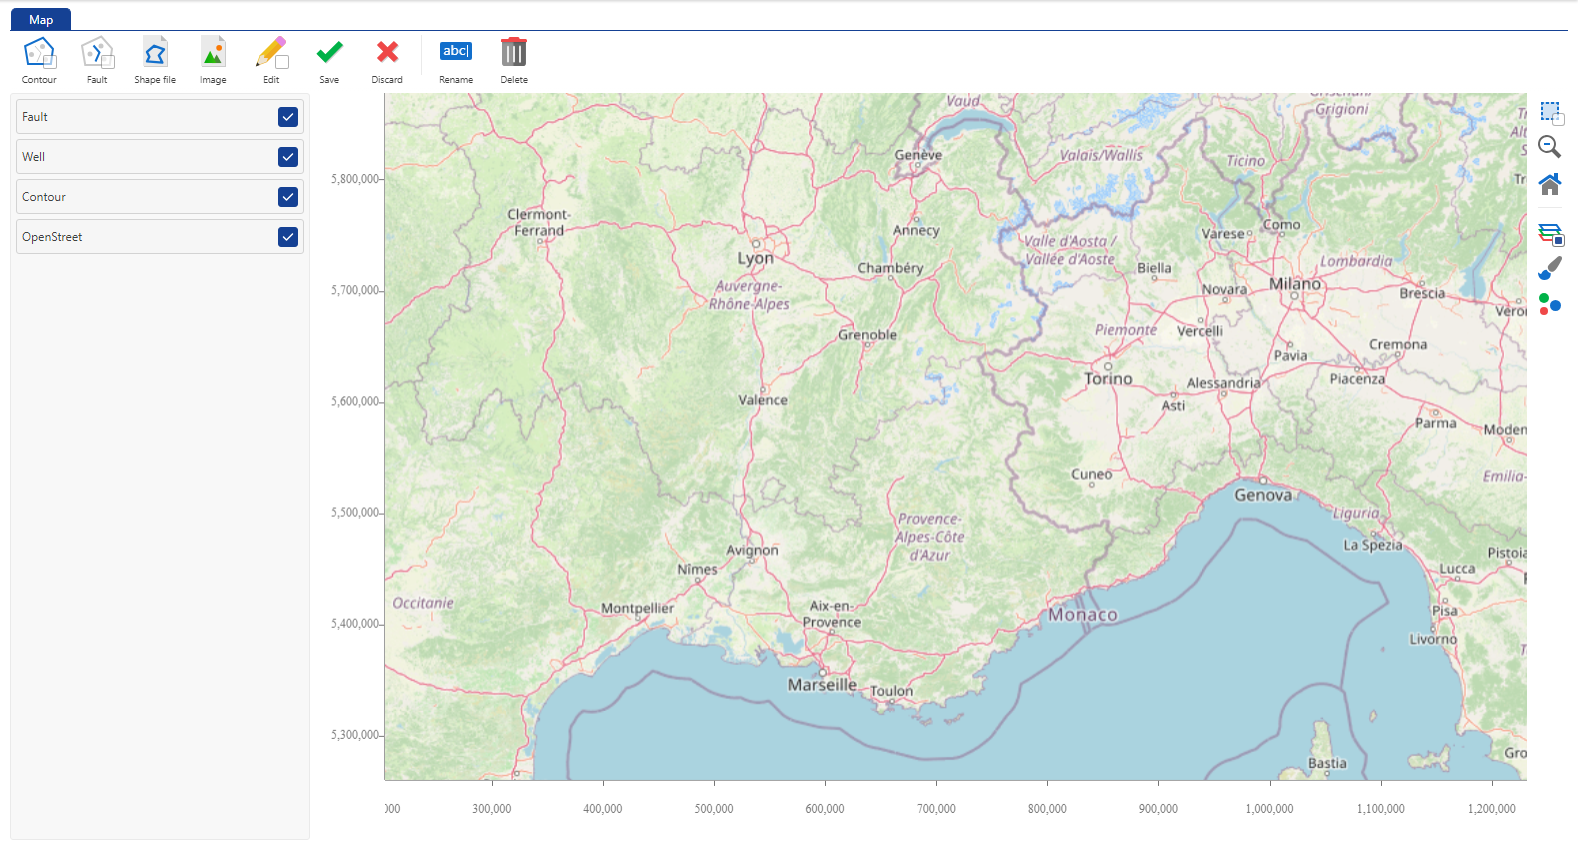
Select whether to show or hide the Faults, Wells, Contours and OpenStreet (map) view on the map.
Once done, click on
to close the layout manager.
Editing Map Aspects
With the map selected, click on
 in the toolbar on the right.
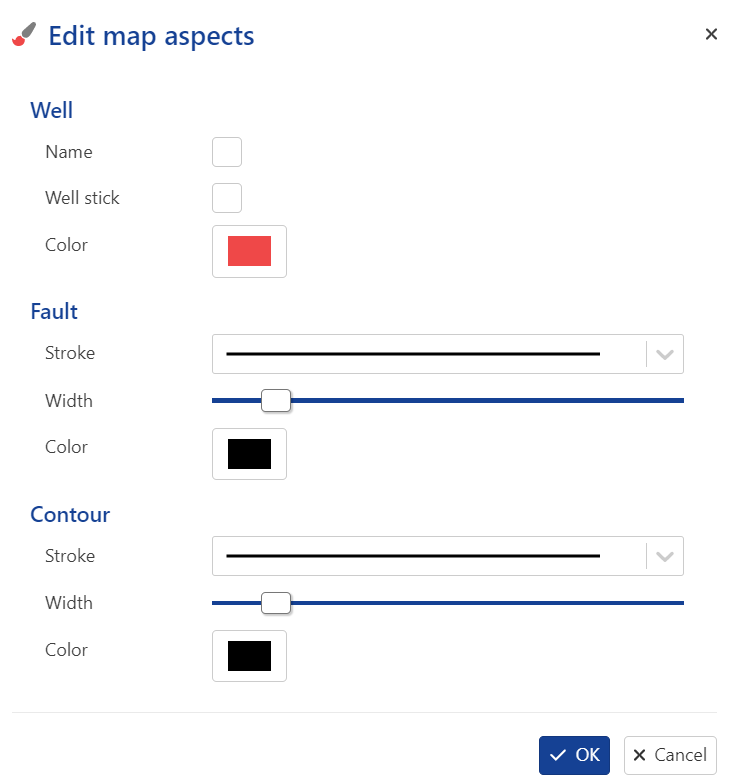
Set the aspects definition for Well, Faults and Contours.
Validate with OK.
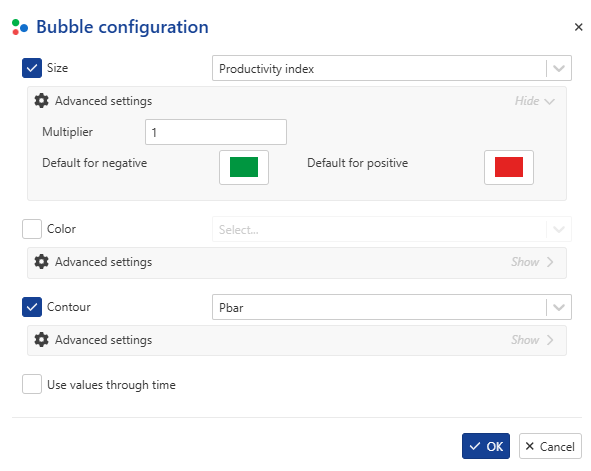
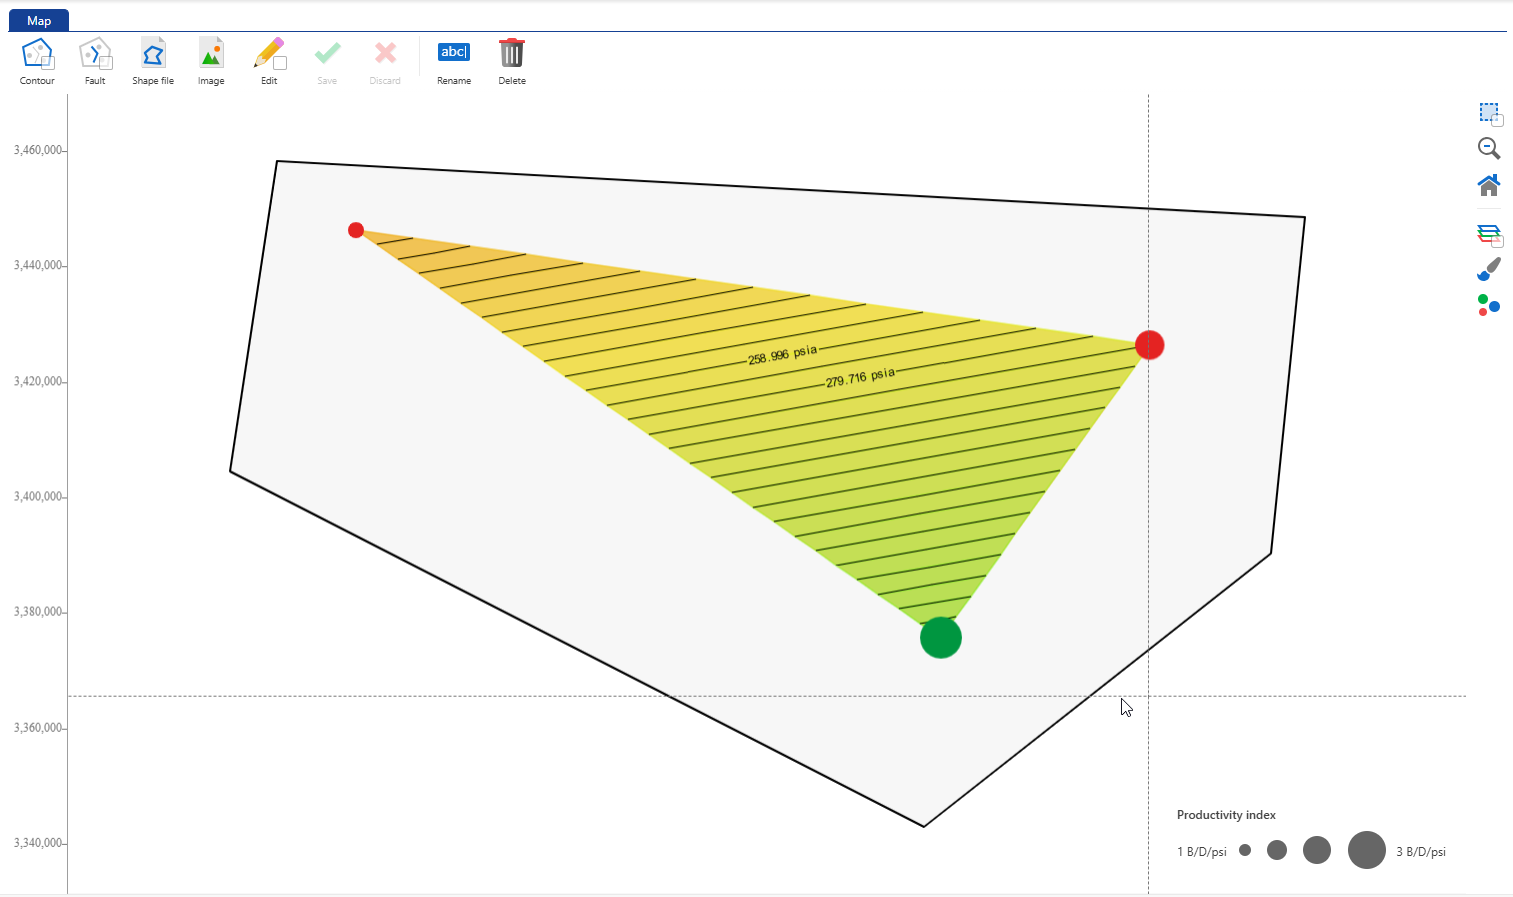
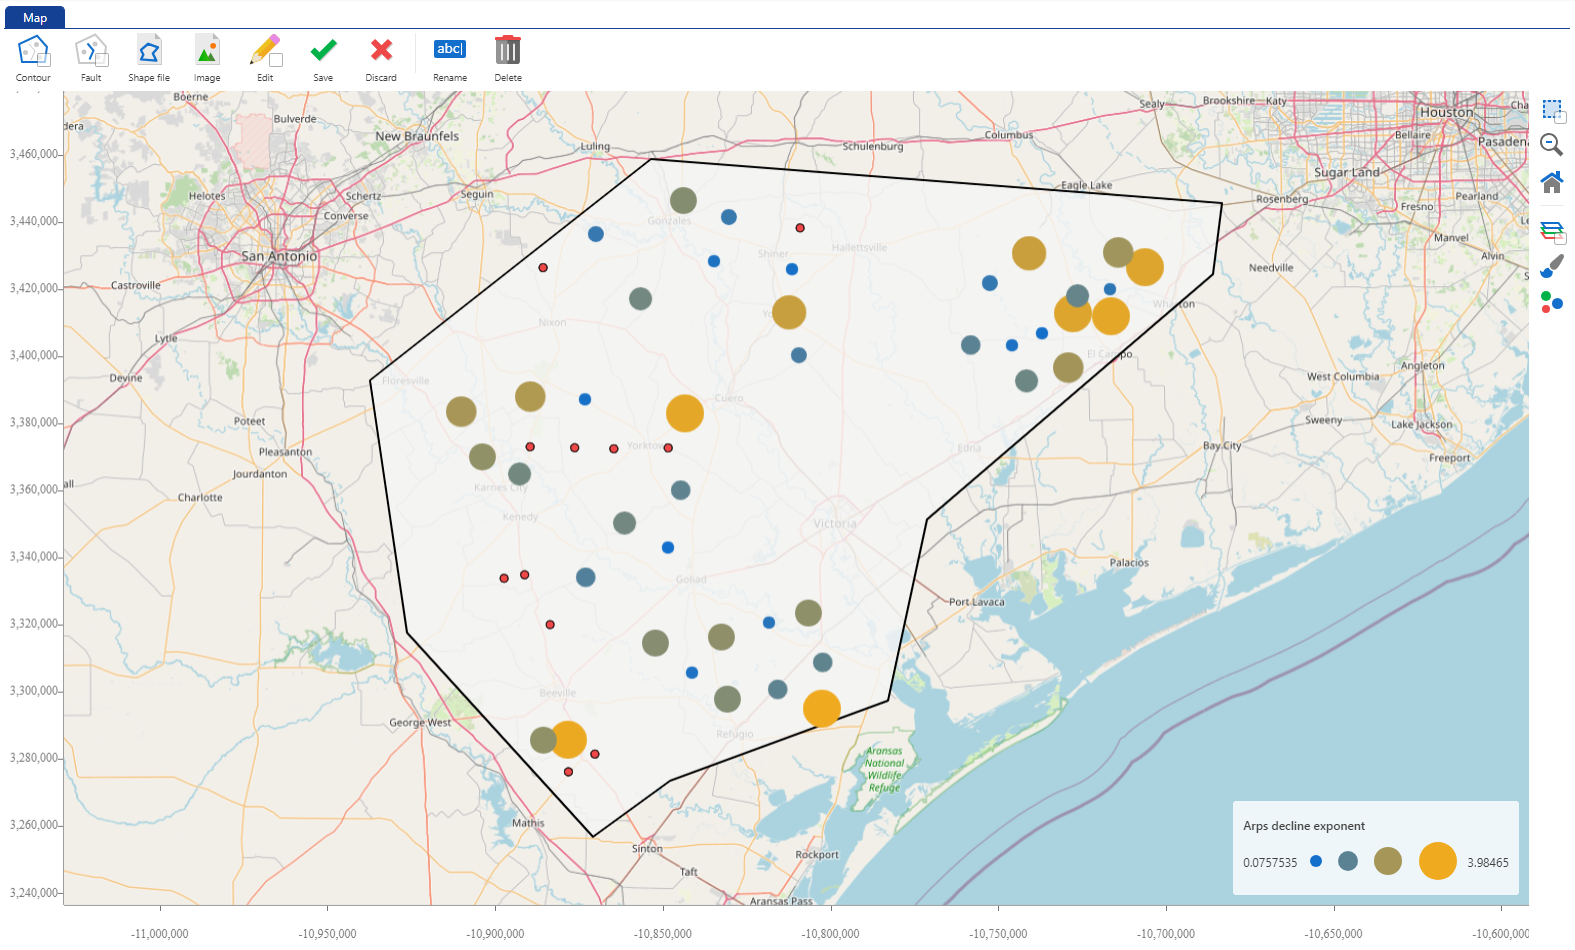
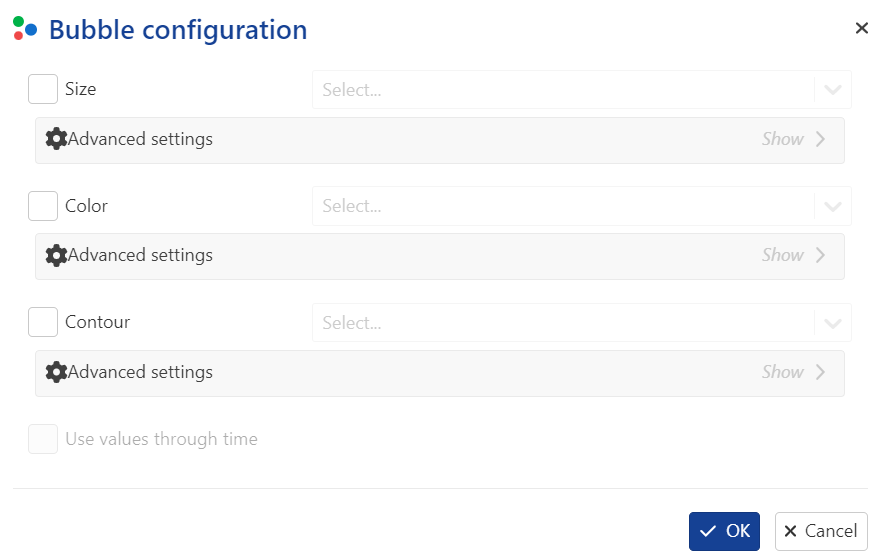
Bubble Maps
Well properties or analysis results may be viewed in form of a bubble map. Three different map properties - bubble size, bubble color & contours, may be assigned three different parameters for display. To access the bubble map configuration, click on  in the tool bar on the right.
 |
Bubble map displays for rate and rate-related well properties now use absolute values for bubble sizes, with red indicating positive and green indicating negative values.