Filtering
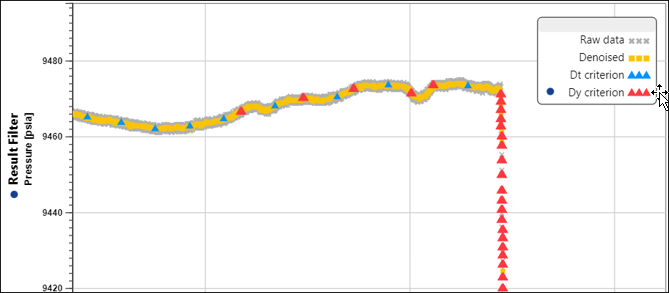
In order to reduce the size of raw time series data, KAPPA-Automate applies denoising and decimation techniques. This involves applying a signal processing technique to identify/sketch a distinct trend in the time series data with inherent noise. The diagram below illustrates an identified trend (orange dots) and the raw data with inherent noise (gray dots).
 |
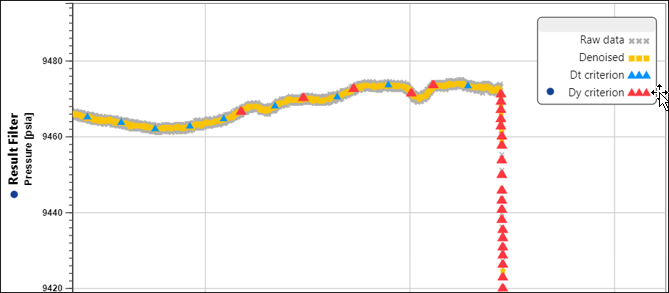
While denoising squeezes the data points into a representative data trend, it does not reduce their number. In order to reduce the number of data points a decimation technique is applied to the denoised data trend. This technique produces a smaller subset of points to represent the data trend. The red and blue dots in diagram below illustrate how denoised data is decimated.
 |
Denoising and decimation function together to identify the data trend and represent it with a fewer number of points by filtering out redundant and/or noisy data. This approach preserves characteristic features such as shut-ins and at the same time reduces the number of points from millions to a manageable size of thousands.
Three main versions of denoising algorithms are available in KAPPA-Automate. The integral filter is another method of filtering.
During the decimation process, it is possible to specify the number of points to retain from the de-noised data. This is set by specifying the “Delta-T max” and/or “Delta-Y max” criteria: one point every Delta-t max, with Delta-y value less than Delta-y max;
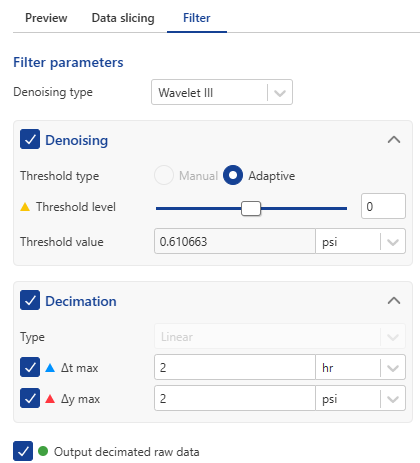 |
∆t max — maximum time between points if the 'delta y' value for them is less than the delta max. Default value set to 2 hours.
∆y max — maximum 'delta y' value between consecutive points. For rates data 'delta y' max is set to 10 stb/d, for pressure data delta y max is set to max (2psi, threshold value).
Output Decimated Raw Data — This option is only available with the Wavelet II denoising algorithm. When set, the Filter process creates an additional filtered data set with raw data points, i.e. the data points retain their original values without any changes due to the denoising algorithm.