Customizing Plot Templates Catalog
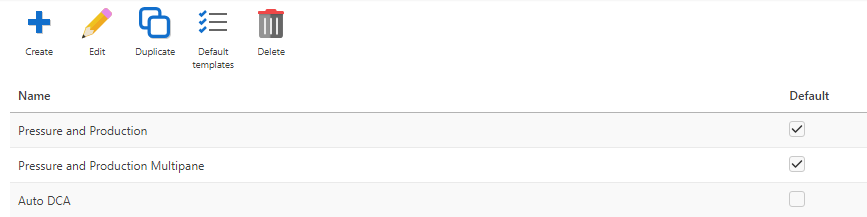
The Global K-A plot templates catalog can be accessed in the Plot templates page under Automation Mode. Changes made here are available in existing fields as soon as they are created.
Under PDG mode, the plot templates catalog can be accessed by selecting the field node in the field hierarchy and clicking on Default template ,  , under the Info tab. The default plot template selected will be used for all wells of the field. The selected template can be changed by selecting another template and clicking on Update.
Creating a New Plot Template
In the toolbar at the top, click Create,
 .
.Give the plot template a Name.
For Plot type, define whether the plot is to be a Time series plot, Cross plot, Bar chart , or By labels.
For Aspect strategy, pick the Color gradient or Dash type.
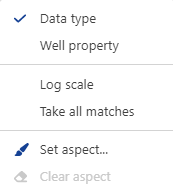
Select Data types, e.g., BHP [Bottom-Hole Pressure], qo [Oil Rate Surface], qw [Water Rate Surface] from the drop-down menu. Data type can be switched to Well property, by clicking on
 at the beginning of each row.
Note
It is possible to add several data types or well properties under the same pane or different panes by clicking on Add data.
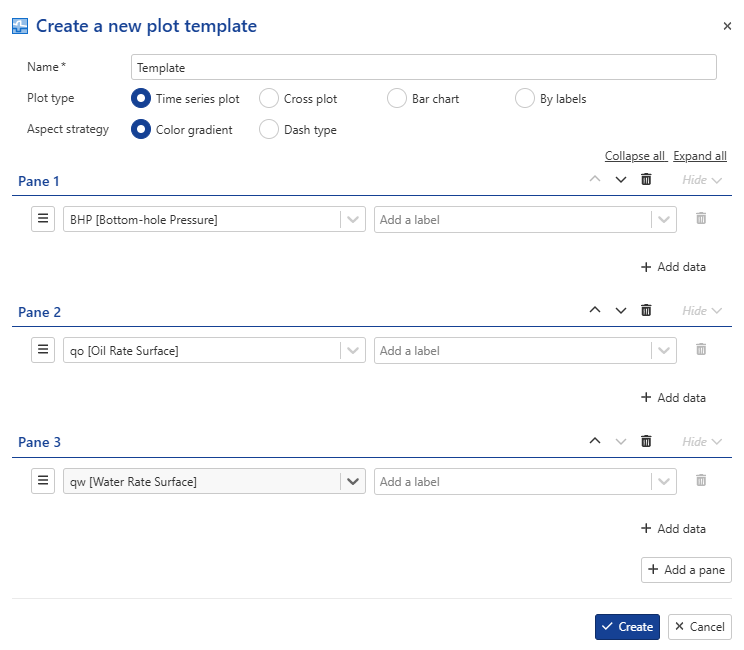
Optional. Select a label for each data type added to the template from the Add a label drop-down menu.
From the same menu allowing to switch from Data type to Well property, Log scale, Take all matches and the data type or well property aspect (Style, Type, Size, Preview and colors) can be defined.
Note
At any time, the user can delete any data type/property or a pane, can show/hide data types/properties inside a pane or collapse/expand all panes at once using the corresponding options. It is also possible to move data types/properties between the panes using Move up/move down arrows.
Note
If Cross Plot is selected, an X axis row is displayed as first row with only Log scale option available for Data type.
Warning
Well properties cannot be used in a cross plot. The user is not allowed to select Well property if Cross plot is selected as Plot type.
Click Create.
Editing a Plot Template
Select the plot template to edit in the Plot templates list.
In the toolbar at the top, click Edit,
 .
.Modify the template as desired.
Click Update.
Duplicating a Plot Template
Select the plot template to duplicate in the Plot templates list.
In the toolbar at the top, click Duplicate,
 .
.By default, the same Name appended with [Copy] is suggested. Amend the name as desired.
If required, add or delete some Data type or Well property and panes.
Click on Duplicate.
Selecting Default Plot Templates
In the toolbar at the top, click Default templates,
 to set the plot templates that will be selected by default and for the three hierarchy levels.
In the Field drop-down menu, select a user defined plot template.
In the Well group drop-down menu, select a user defined plot template.
In the Well drop-down menu, select a user defined plot template.
Click on Update to confirm your selection.
Deleting a Plot Template
Select the plot template to delete in the Plot templates list.
In the toolbar at the top, click Delete
 .
.