Automatic RTM (aRTM)
The aRTM workflow starts using a PVT object under the selected level. The workflow then:
Creates a new Topaze file, which is a copy of the seed document.
Updates well radius, net pay, porosity, initial GOR and Temperature Bottomhole from well properties in the generated file.
Loads pressure and rates into the file.
Activates unconventional option in Topaze file.
Extracts from Peak rate and auto-fit using the power law tool with 1 or 2 segments, depending on the user's judgement.
Initializes the model parameters from the tool.
Runs the analytical model (SRVB/Trilinear/MZFD).
Improves on cumulative production.
Runs a forecast.
Note
In aggregator node, you can find all the aRTM executions for the selected field.
It is also possible to create aRTM by making selections in the well flat view.
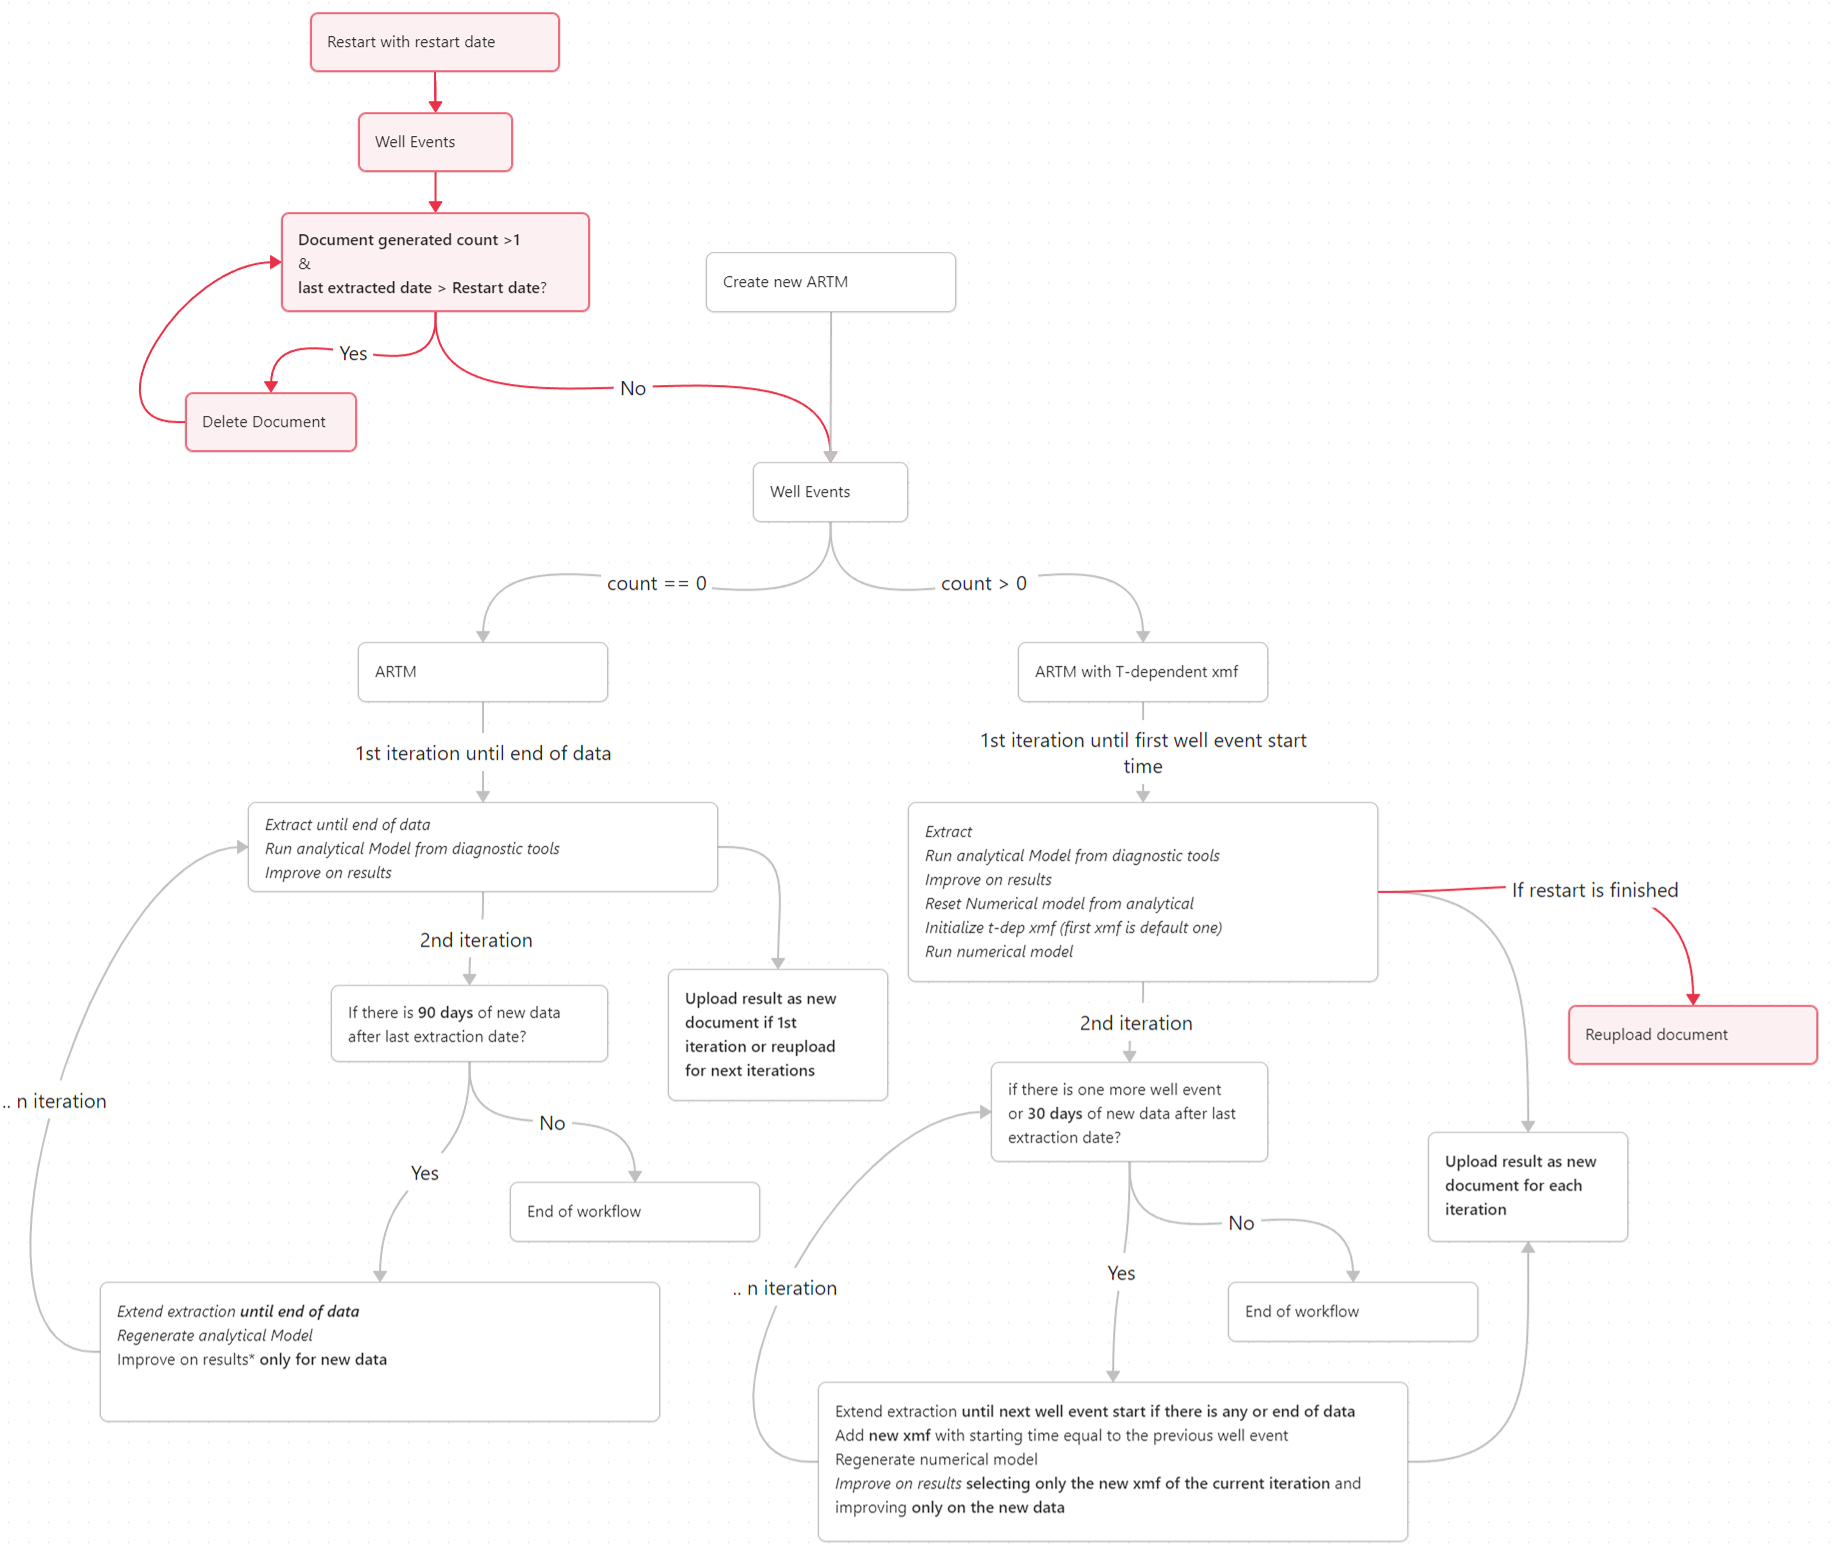
aRTM Behavior When New Data Arrives
When new data arrives:
aRTM checks how much new data is available after the last extraction.
An Improve runs only when the minimum duration is reached:
90 days for standard runs.
30 days when using time dependent Xmf introduced based on well events if no new well event is reached by the data.
When triggered, the Improve process uses only the newly available data as the objective function.
If the available data duration is less than threshold (90 or 30 days):
A forecast is automatically generated whenever a new data point arrives.
For the first document, when no well events overlap with the available data, extraction goes to the end of data; a second iteration runs only if 90 new days are available. Otherwise, the extraction terminates at the first well event.
For later documents, extraction follows well‑event boundaries; a new iteration runs only if another event exists or 30 new days are available.
Each iteration updates the analytical or numerical model and adds new XMF segments when needed.
The workflow stops when no more events or sufficient new data remain.
The image below illustrates the workflow:
 |
Viewing aRTM Results
When an aRTM is first launched, it will create a new container under Well properties node in the field hierarchy, named Container for <aRTM Name>.
 |
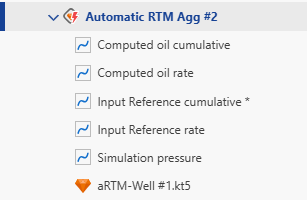
A new folder called Workflows will also be created in the field hierarchy, with the aRTM and any files created by this aRTM listed there. Depending on the selection of output gauges when creating the aRTM, the computed reference phase cumulative and computed reference rate are created under the parent well:
Computed channels are generated by:
Extracting a segment of data of length n (the duration of data to analyze) from each output document.
Combining these segments to produce the computed rates.
If only one output document exists, the computed channel is simply a copy of the simulated channel in Topaze.
 |
One can run several workflows in parallel and compare them.
It is also possible to copy from in iPTA container into the Master container. If Replicate results to Master flag was enabled when creating the iPTA, this will be done automatically for all shut-ins being processed by the iPTA task.
Alternatively, users can selectively replicate results for some analyses only to the Master well properties container (see [Result Replication into Master Well Properties] for more details).
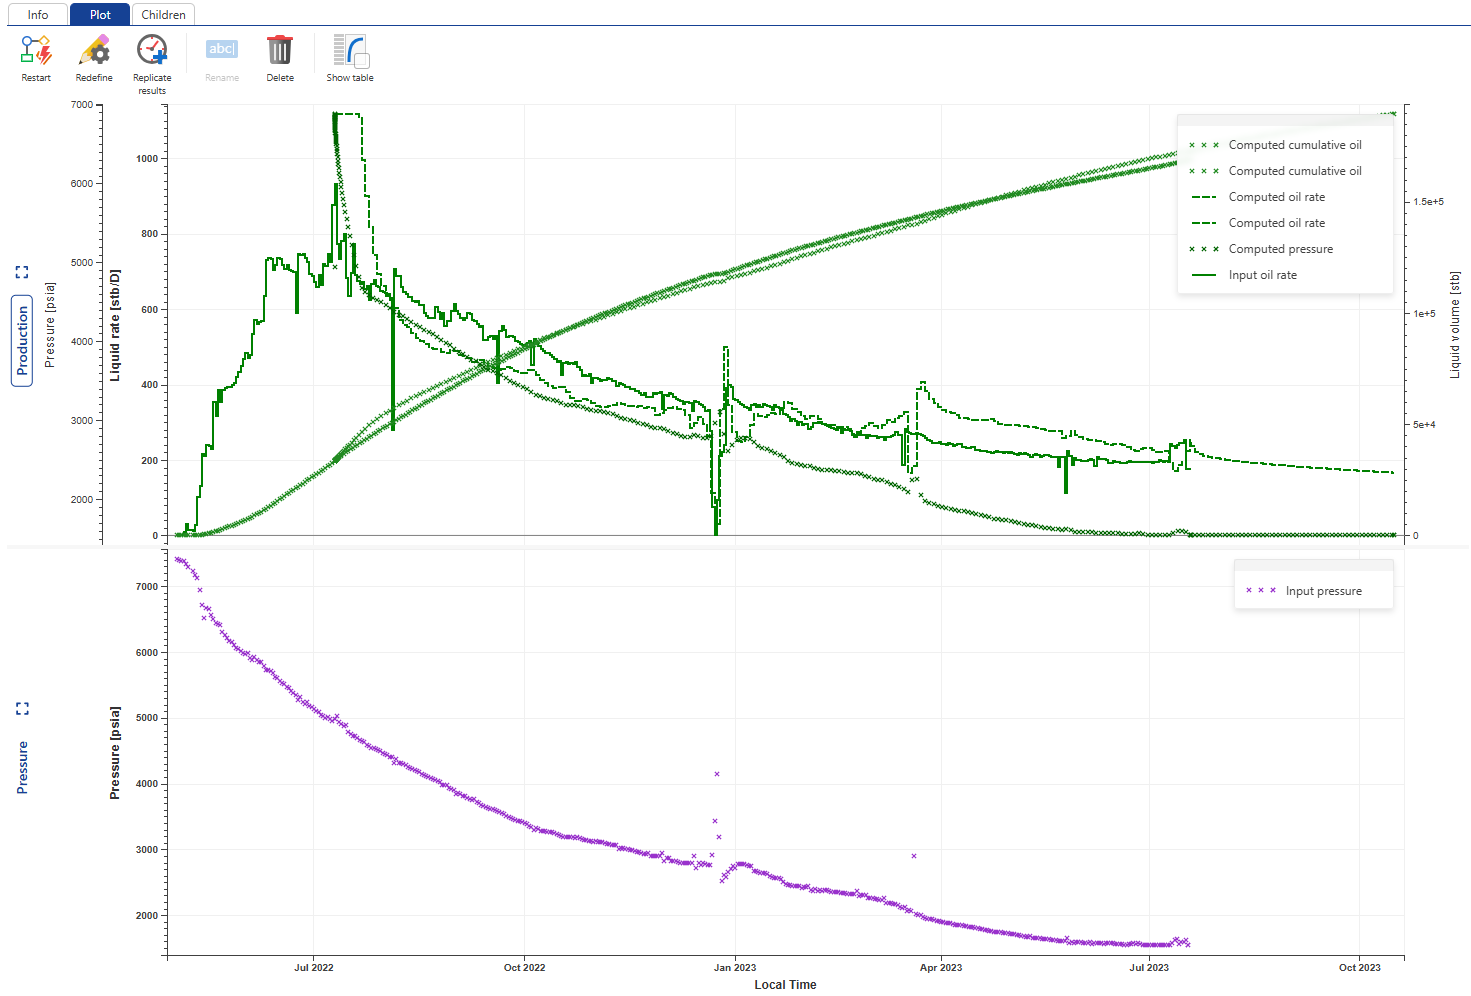
aRTM plot
It is also possible to view the aRTM result as a plot. To do so:
In the well node, click on the workflow folder.
Click on aRTM node, then switch to the plot tab.
In this plot, you can see input rates, input pressure and outputs.
 |