Monitoring Mode
The Monitoring Mode consists of two sections:
Jobs
Monitoring

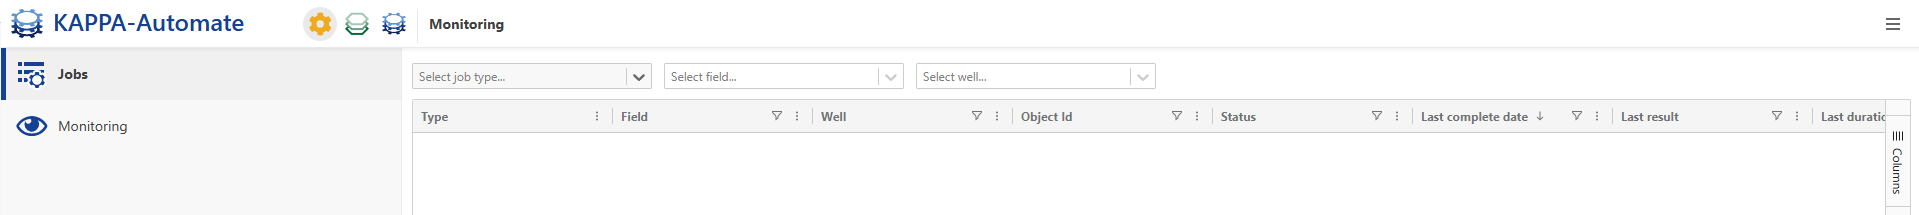
The activity of the services and jobs can be monitored over a desired period of time. In particular this mode gives access to a list of the ongoing jobs.
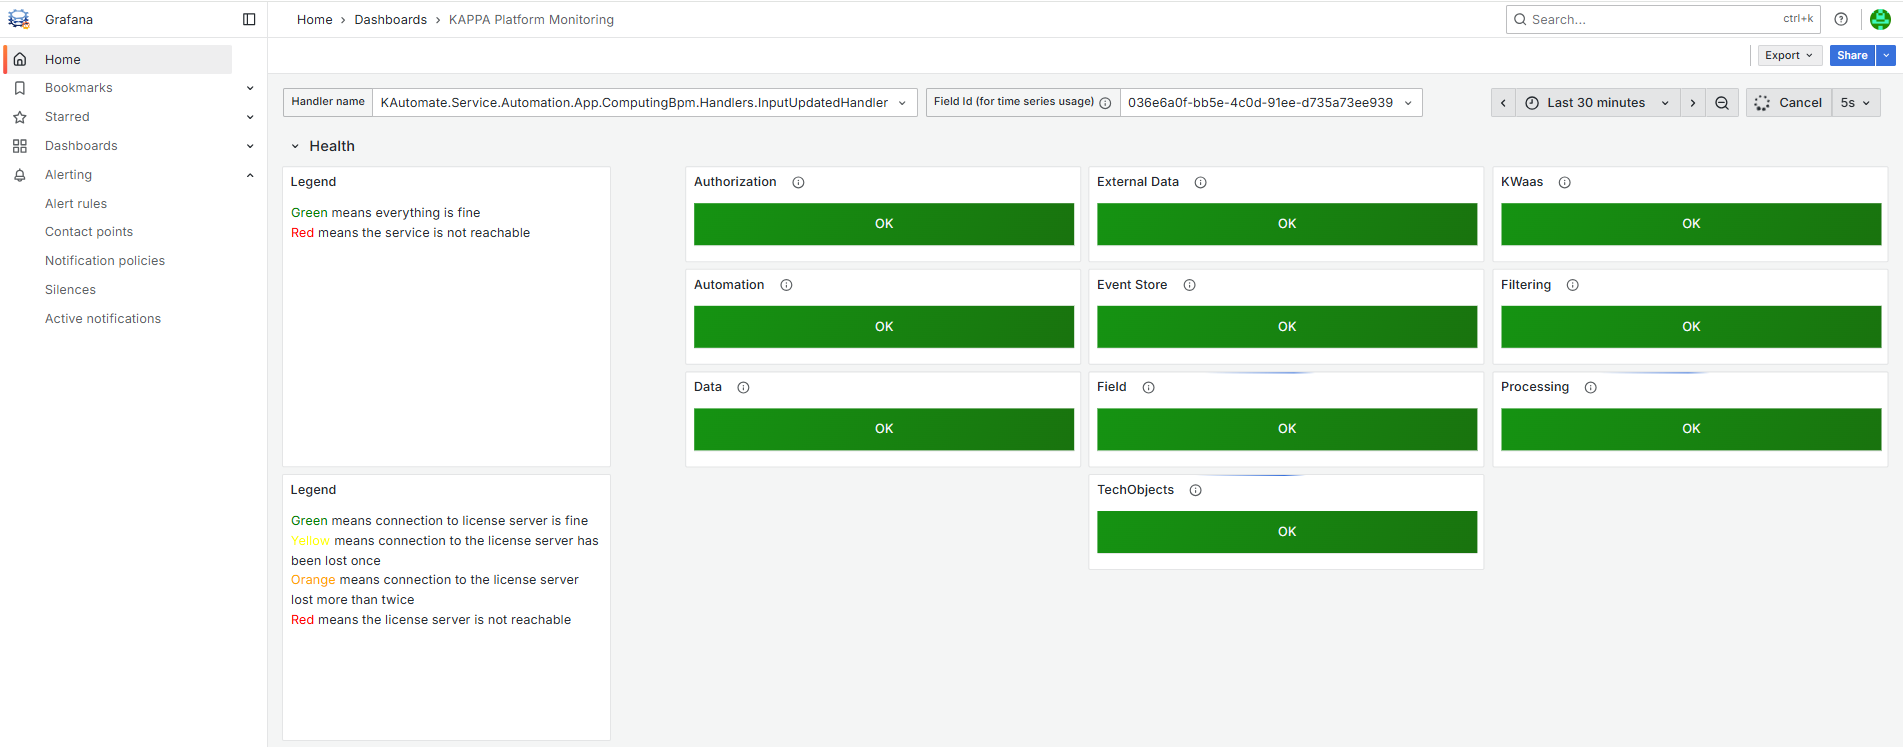
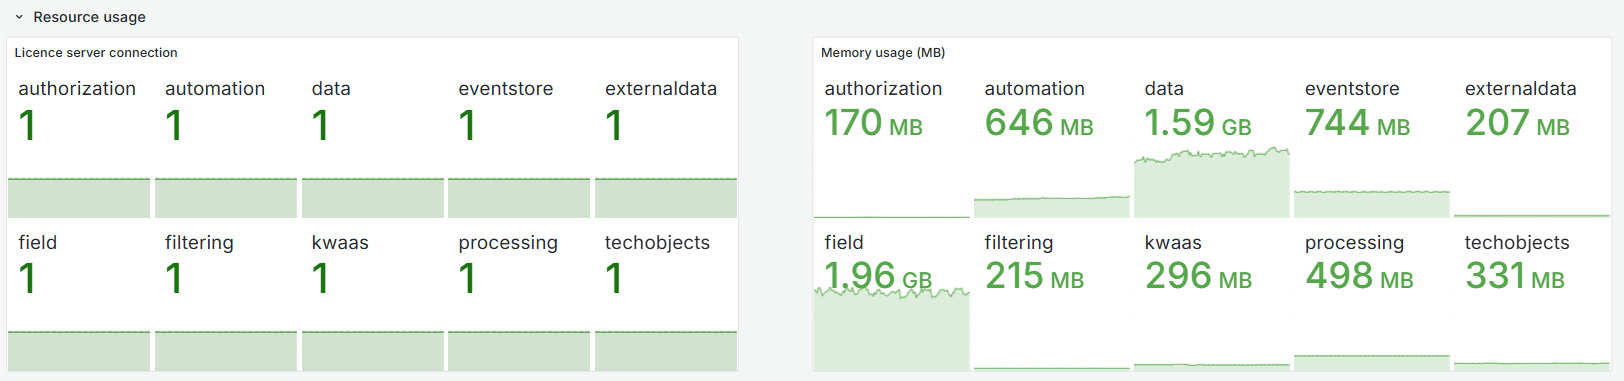
Sorting Job Information
The user has the ability to sort the job information, by clicking once in the column header, , and by using the corresponding arrows to sort by ascending or descending order.
Filtering Job Information
By clicking on in the column header, the user has access to the filter options.
A filter may be applied to the data by clicking on , in the column header, and specifying the filter criteria. Once a filter is applied, the Filter,
, icon is displayed in the column header. The filter definition may be edited or deleted by clicking on
to access the Filter options
.
Handling Columns
The columns can be rearranged by dragging (click and hold left mouse click) the column header to the new location. Dragging the column header out of the table 'area' will hide the column from display. To bring back a hidden column, click on in the column header and select the desired column,
The user can customize and reset the column size, by clicking on to pin, autosize and reset the columns display preferences.
Refreshing Job Information
The job table is automatically refreshed every 20 seconds, but the option can be disabled by unticking the corresponding option, and a refresh can also be manually triggered by clicking on .
Visualizing Objects
The user can visualize an object in the field hierarchy, by clicking on a desired Object Id.
Note
The visualization of the job in the field hierarchy is not available if the selected job is starting or running.
Exporting Job Information
The displayed information can be exported. The file types are Comma Delimited (CSV) and Excel (.xlsx and .xml).
Definition column to job view
A definition column has been introduced to the job view in monitoring mode, providing brief descriptions of each user task or function.
Accessing Job Status
Status | Description |
---|---|
(Select All) | This checkbox displays all the job status in the table. |
| The job is not in the scheduler but may be triggered by another job. |
| The job is not running. |
| The job is currently running. |
| The job is planned to be executed in the scheduler. |
| The job is starting. |
Accessing Last Job Result Status
Status | Description |
---|---|
(Select All) | This checkbox displays all the job status in the table. |
| The job has failed to run. |
| The job has successfully ran. |
| The job has been interrupted because it was taking too long to process. |
| Not applicable. |
This option will switch to Grafana Dashboards. The Dashboards provide different views of application logs and metrics (several types of statistics are available).

