PDG Mode
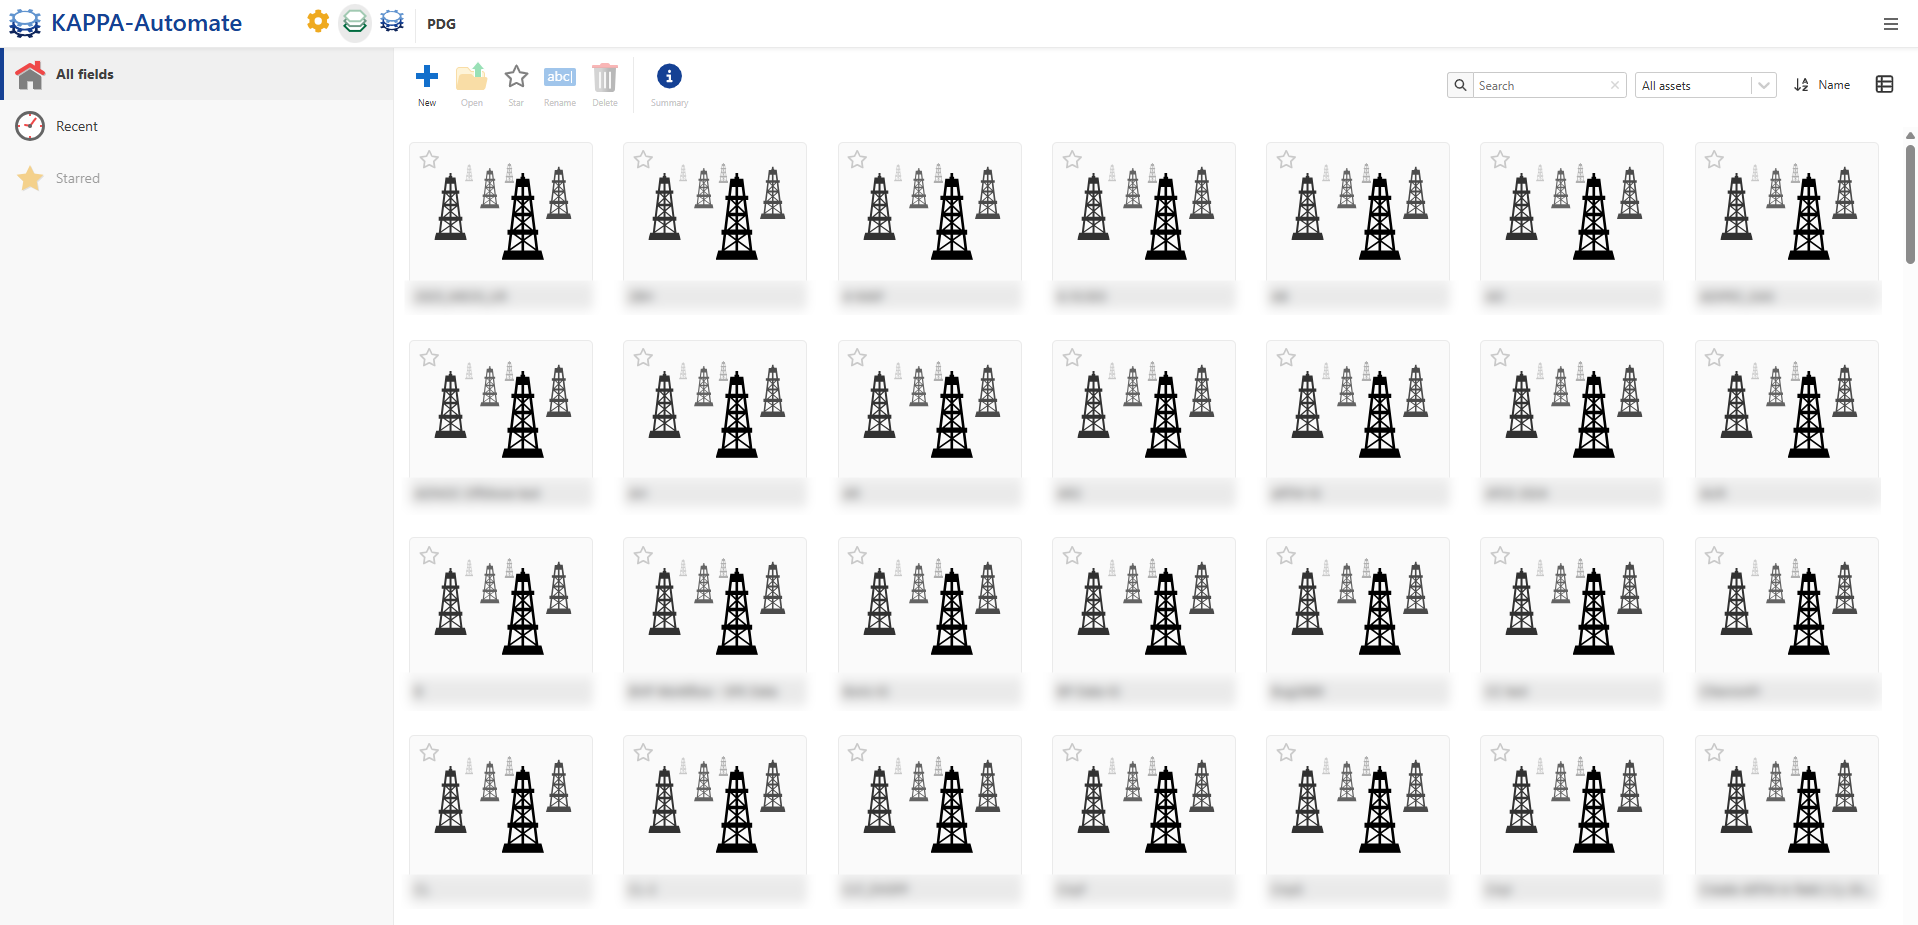
The PDG Mode landing page provides access to the Producing Assets (Fields) within KAPPA-Automate. Users can Create a new Field or navigate to a selected Field to perform Reservoir Surveillance activities.
 |
Within the PDG Mode and once you have opened a field, there are four views in which you can display your data.
 |
Tree View
Field elements are represented in the default Tree View. Clicking on any node adapts the working area and displays plots, tables, and additional information.
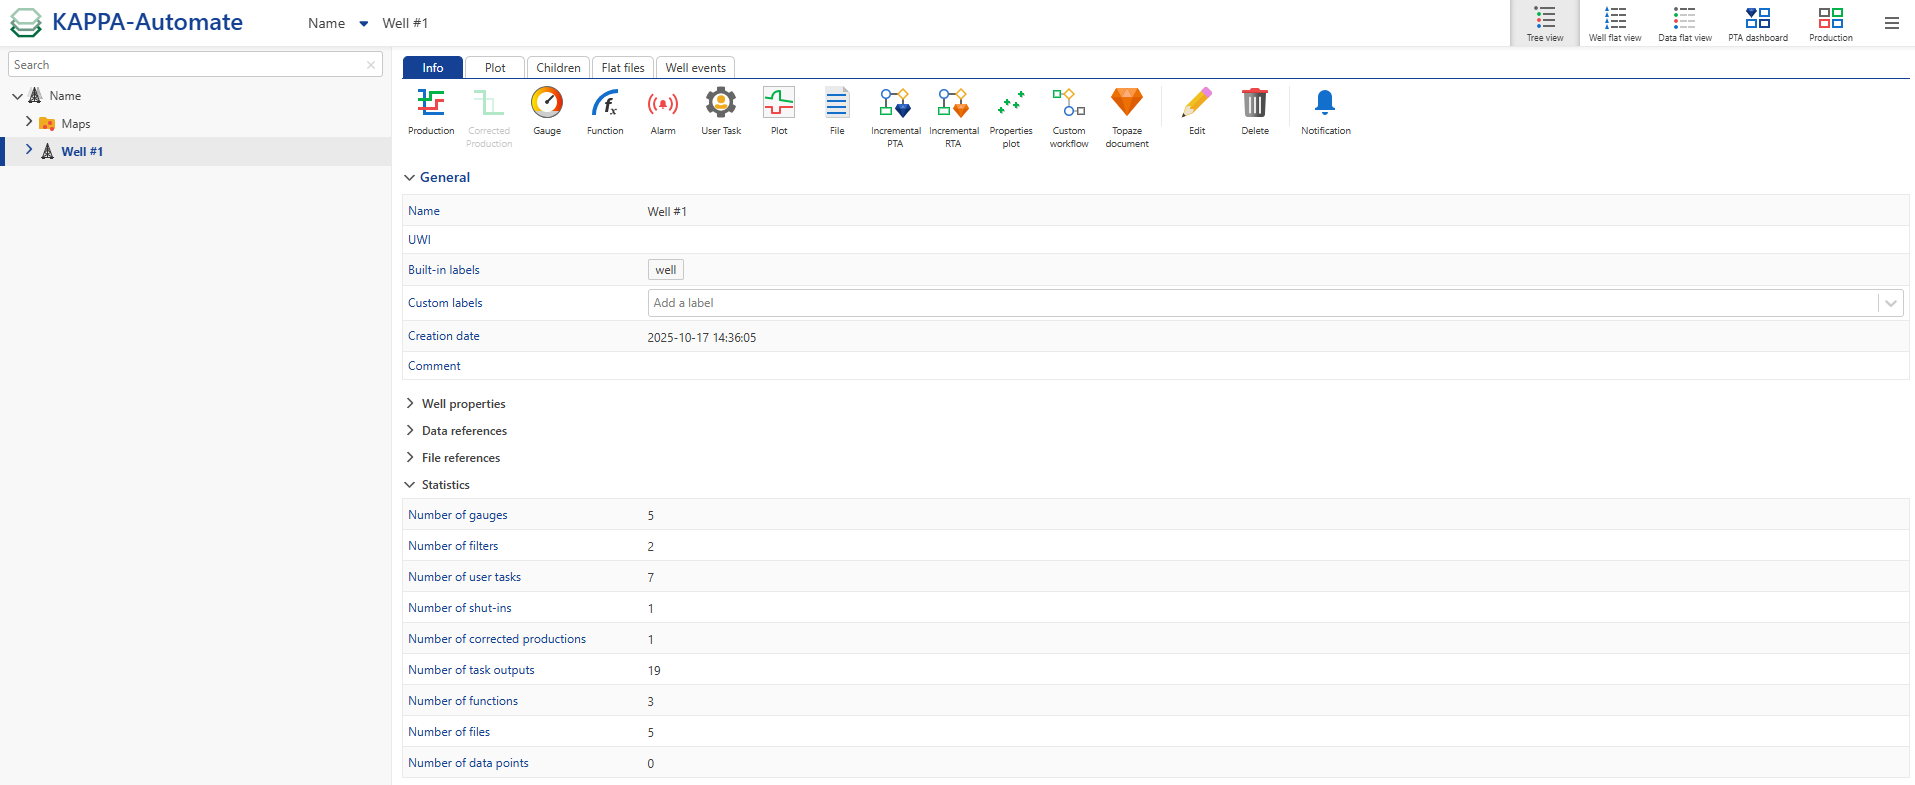
Important
For all objects and at all levels, values displayed in the Info tab can be copied using the Copy option ,
 , whether the value is text, time, or numeric.
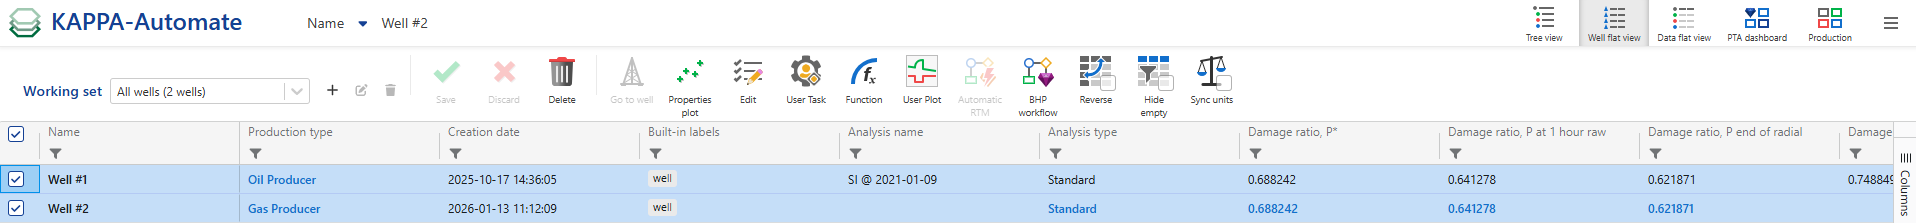
Well Flat View
Designed to view alongside all well properties and create subsets of wells or working sets, this mode can be used to set values in bulk, or to simultaneously create user tasks for a group of wells. See Well Flat View
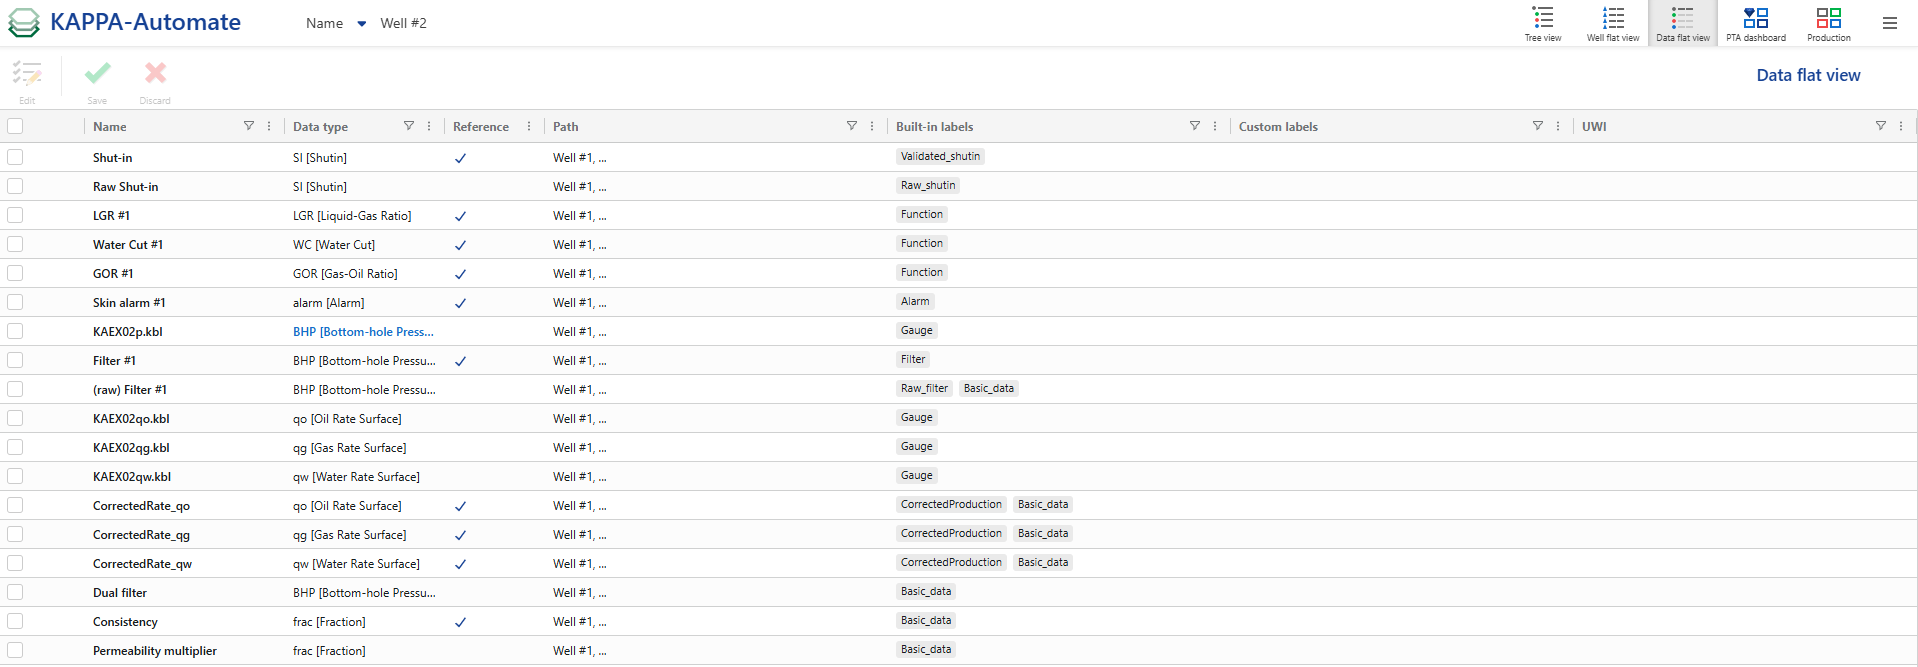
Data Flat View
Presents all the gauges across the field as a flat list. It provides an instant view of all available data. It can be used to assign, or simultaneously change, data types and labels for a selected group of gauges. See Data Flat View
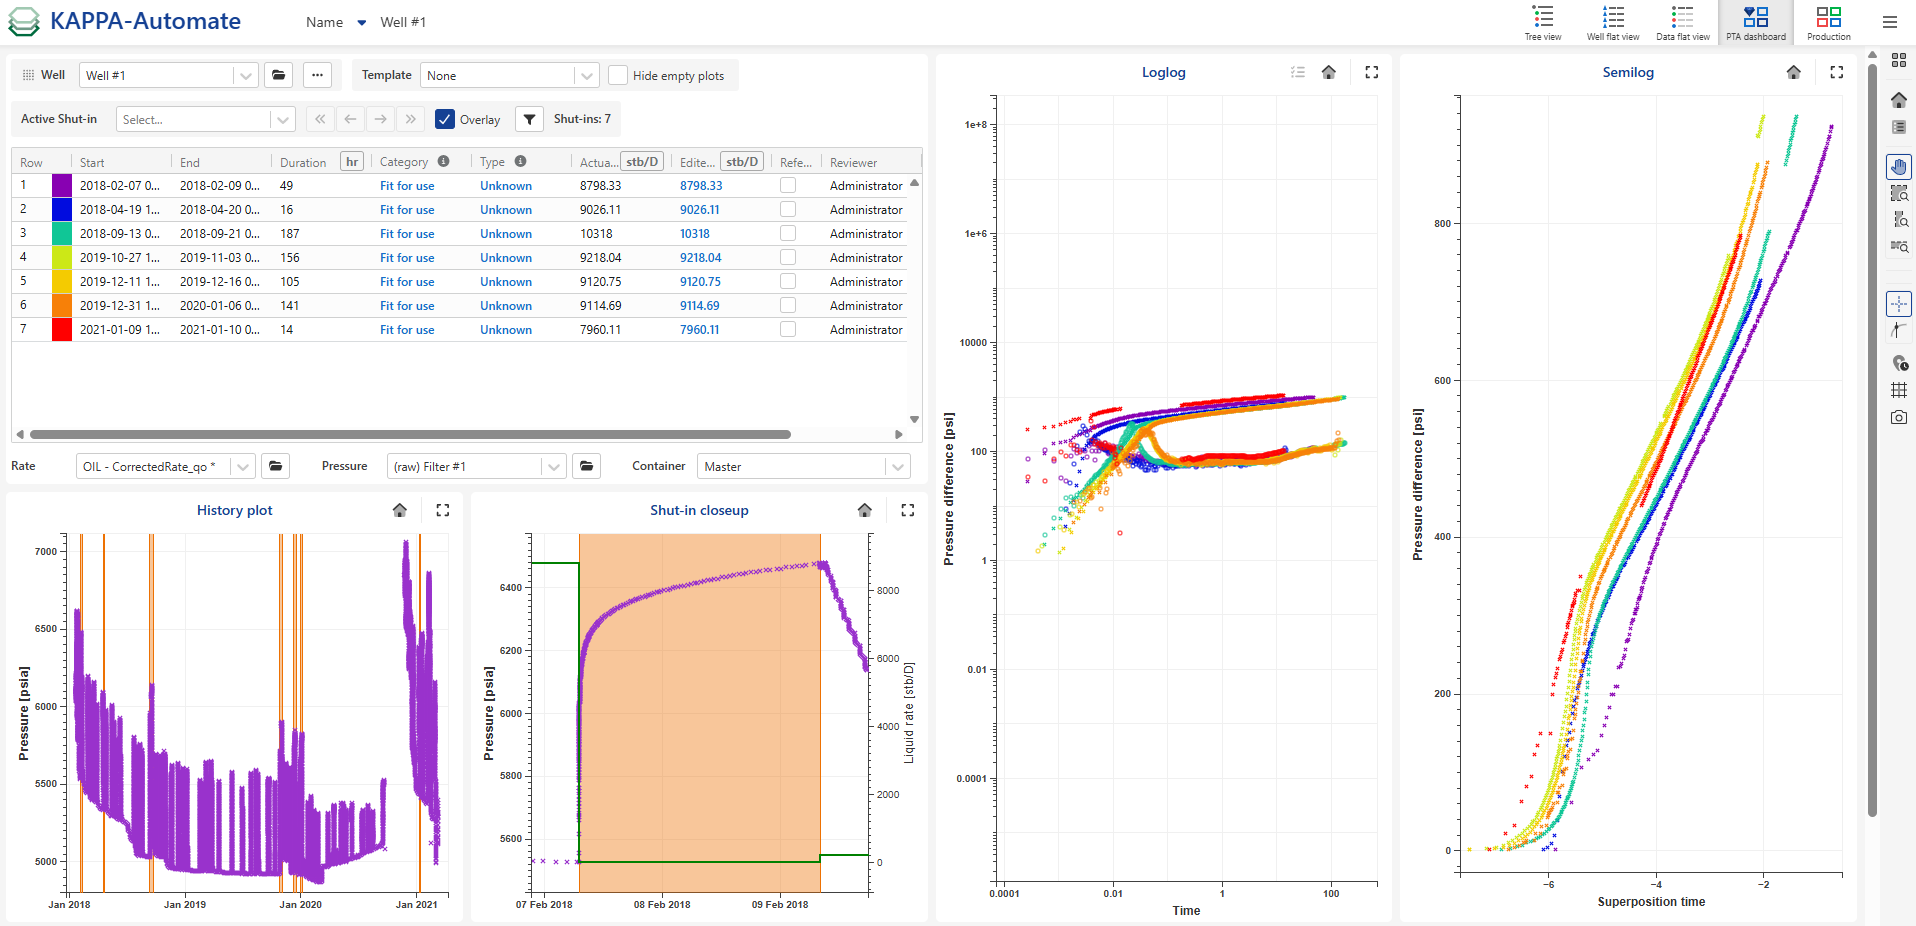
PTA dashboard
Allows to get comprehensive details for the chosen well, allowing to monitor its performance evolution over time. This mode displays diverse data through plots, including history plots, detected shut-in events, corrected productions, pressure. Users can navigate through the wells within the field, exploring information related to shut-ins, pressure, and rate.
Production Dashboard
Offers a powerful and intuitive way to visualize, analyze, and compare production and pressure data for a single well or a selection of wells. It helps users gain better insight into well performance and reservoir behavior over time.
Customizing the View per Field
Users can now define a default view for each field. To do so:
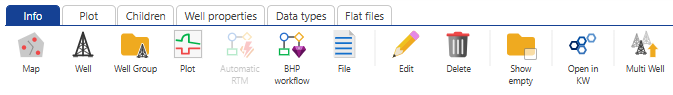
Select the field, then go to the Info tab and click on Edit.
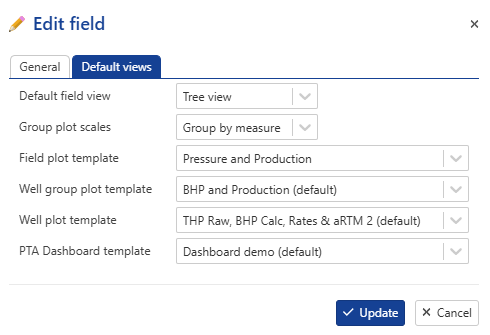
In the pop-up dialog, switch to the Default View tab.
Choose the desired view to apply to this field.
The selected view will be persisted each time you select the field.
 |
Note
Additionally, it is also possible to specify the “Group By” option in the plot settings for this field.
It is also possible to set several default templates, such as:
Field plot template
Well group template
Well plot template
PTA dashboard template