Plot Templates
Plot templates can be created at the global K-A level, at the Field and Well level.
At the global K-A level: plot templates can be created in the Plot templates page under Automation Mode. Changes made here are available in existing fields as soon as they are created. For further information, please refer to Customizing Plot Templates Catalog.
At the Field level: under PDG mode, the plot templates catalog can be accessed by selecting the field node in the field hierarchy and clicking on Default template ,
 , under the Info tab. The default plot template selected will be used for all wells of the field. The selected template can be changed, selecting another template and using Update.
At the Field level: under PDG mode, plot templates can be created by selecting the field node in the field hierarchy and clicking on Set template ,
 , under the Plot tab. The plot template created will be used at the field level. The template is specific to the Field, unless it is copied to the global catalog using Copy to global.
At the Well level: under PDG mode, plot templates can be created by selecting the well node in the field hierarchy and clicking on Set template ,
, under the Plot tab. The plot template created will be used at the well level. The template is specific to the well of the Field, unless it is copied to the global catalog using Copy to global.
Applying a Default Plot Template at the Field Level
Select the Field in PDG mode.
In the toolbar at the top, under the Info tab, click on Default Template,
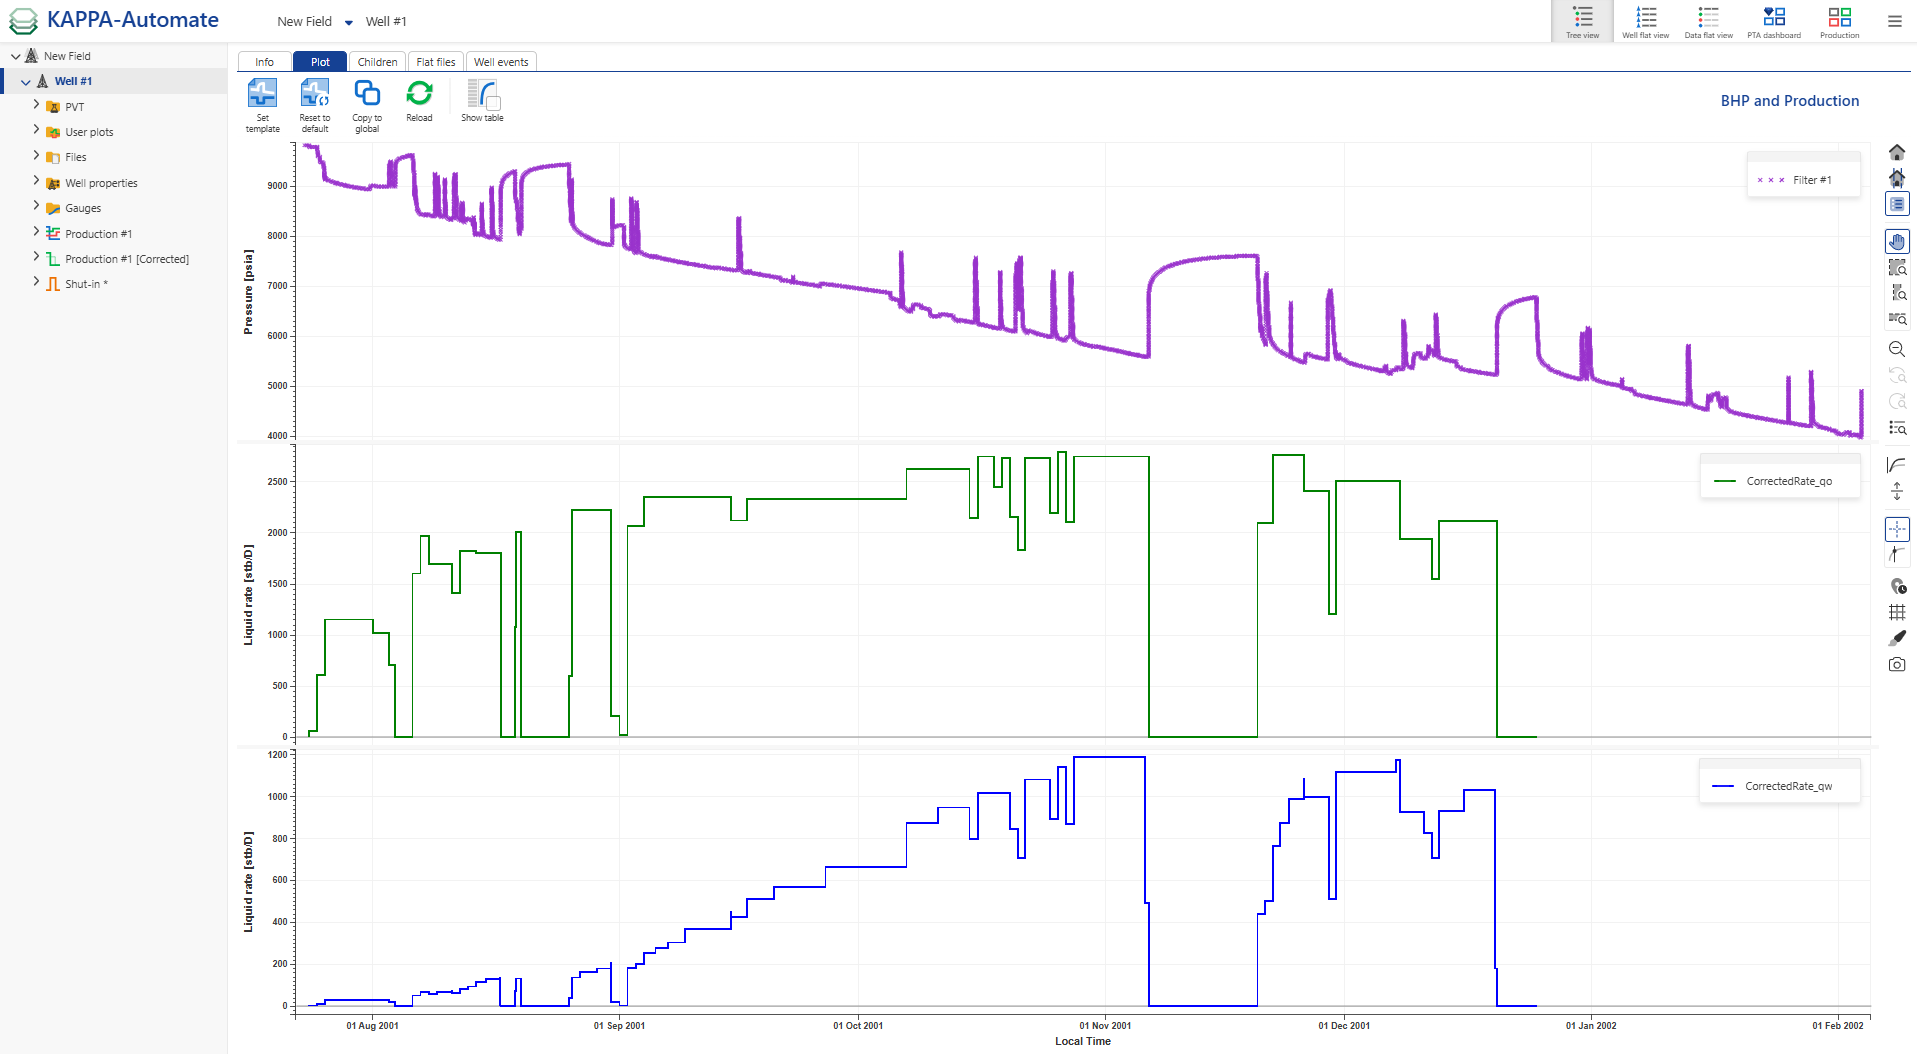
.In the Default plot template dialog, select a template (e.g., with BHP [Bottom-Hole Pressure], qo [Oil Rate Surface], qw [Water Rate Surface] defined as Data types) from the drop-down list and click on Update.
Click the Well node.
Select the Plot tab. The BHP [Bottom-Hole Pressure], qo [Oil Rate Surface], qw [Water Rate Surface] are displayed in three distinct panes as defined in the selected template.
Note
The same plot template will be applied to each well below the field.
Creating a Plot Template at the Field or Well Level
Select the Field or Well node in PDG mode.
In the toolbar at the top, under the Plot tab, click Set template,
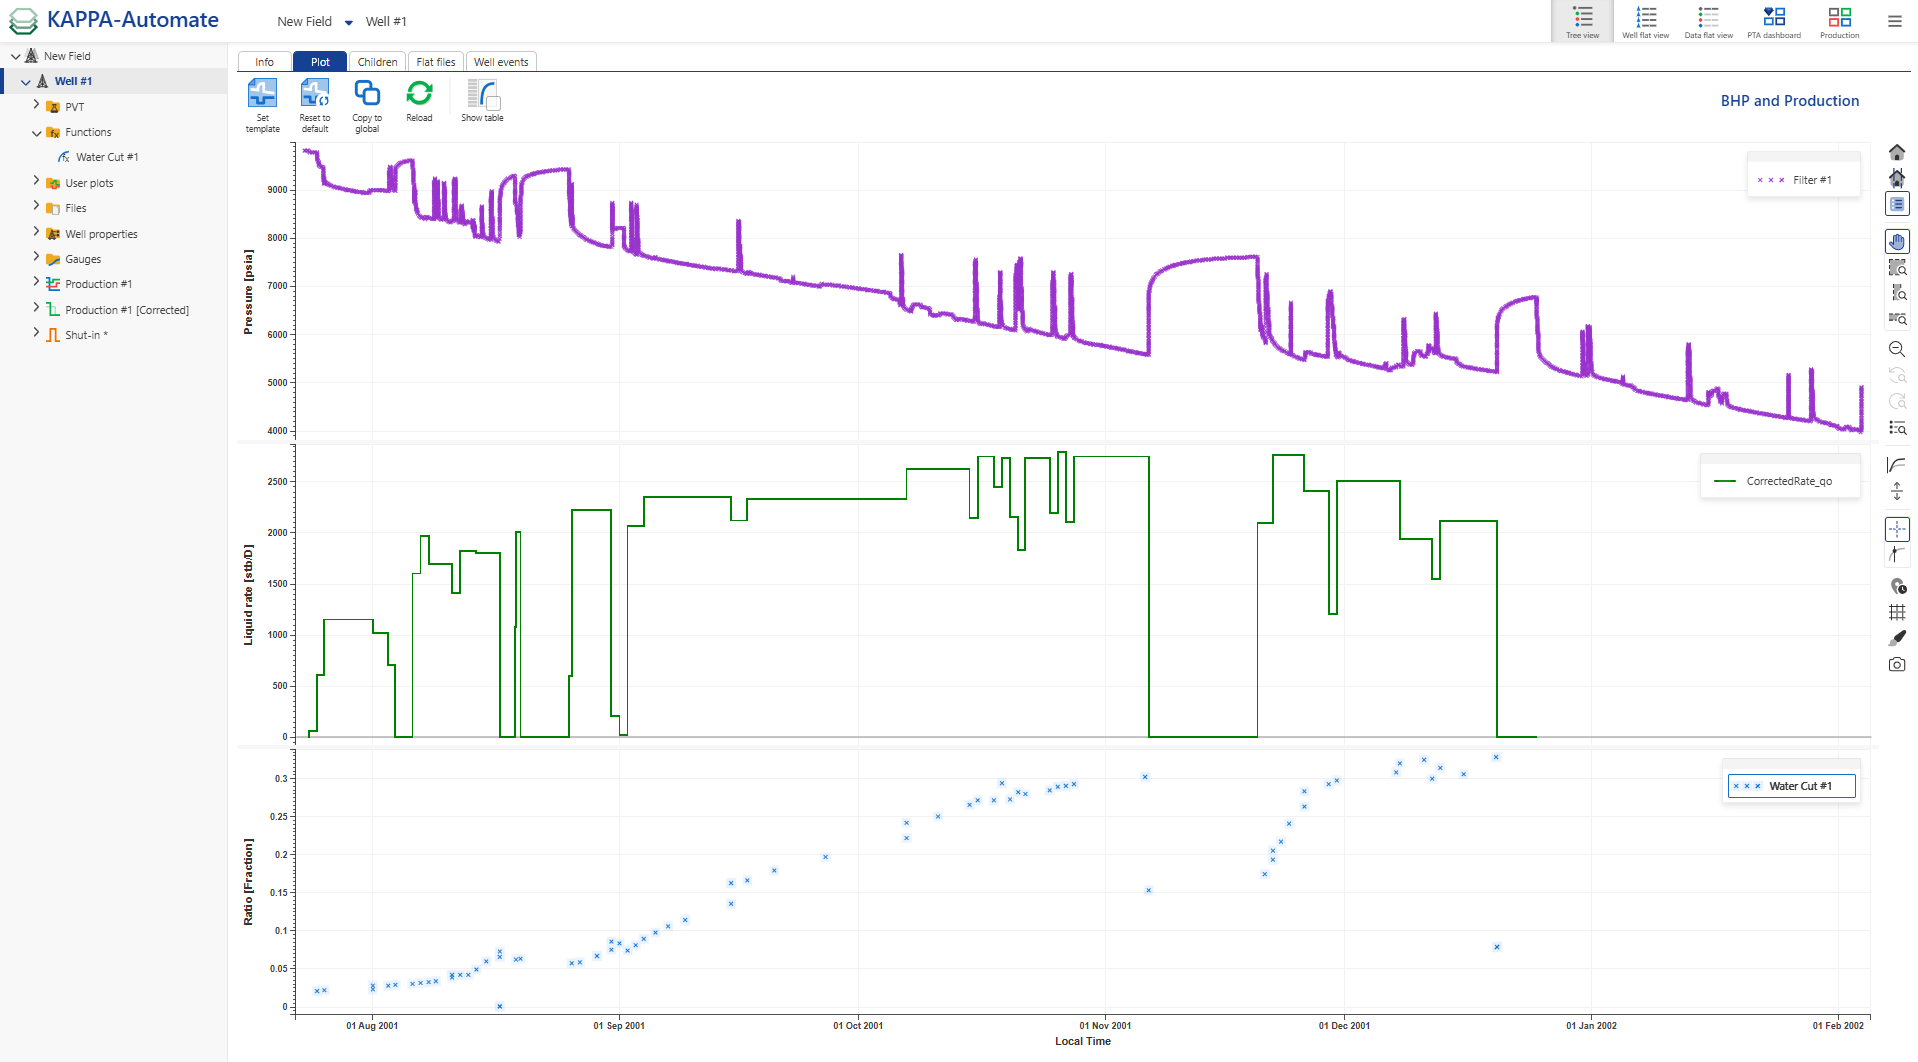
. This action will recall the default plot template in use, as explained above.Modify the template previously created in the section above. As an example, replace the third pane Data type of the template, e.g., qw [Water Rate Surface] with WC [Water Cut].
Click Set. The plot view is automatically updated with the modification brought to the template.
Note
The Plot template created has been defined at the Well level and will be specific to the well. It will not affect any other well contained in the field.
Resetting to Default Plot Template
Select the Well node in the field hierarchy for which a plot template has been defined.
In the toolbar at the top, under the Plot tab, click on Reset to default,
 to reset the plot template to the default one, selected at the Field level.
The plot view is automatically updated with the Data types defined in the Plot template defined at the Global K-A level, i.e. BHP [Bottom-Hole Pressure], Qo [Oil Rate Surface], qw [Water Rate Surface]. WC [Water Cut] is not shown anymore.
Copying a Plot Template
Select the well node.
In the toolbar at the top, under the Plot tab, click Copy to global,
 .
.Define the Name.
Click Copy.
Reloading Plot Contents
Select the well node.
In the toolbar at the top, under the Plot tab, click Reload,
 .
.