Well Event
The Well Event feature allows users to capture the complete operational history of a well throughout its lifecycle. It enables logging of any operation performed on a well, such as acid stimulation, fracturing, workover, and others,under a dedicated tab at the well level.
To do so:
A Well Event can be created either from the Well Events flat view or graphically from a time series plot.
From well events flat view
Click on the well level in the hierarchy.
Switch to the Well event tab.
Click on
 to add a new event.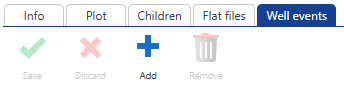
In the pop-up dialog ,enter:
Date of the event.
Type of event.
Optional. Any comments.
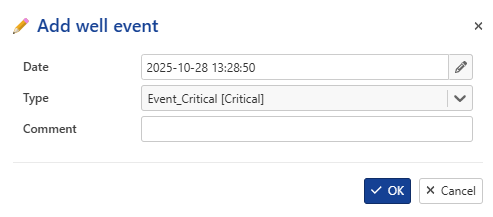
Click OK, then choose to Save or Discard using
 or
or  respectively.
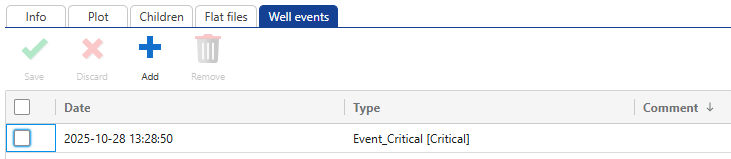
Once created, a well event can be:
Edited by double-clicking on date or type column.
Deleted by selecting it and clicking
 .
.
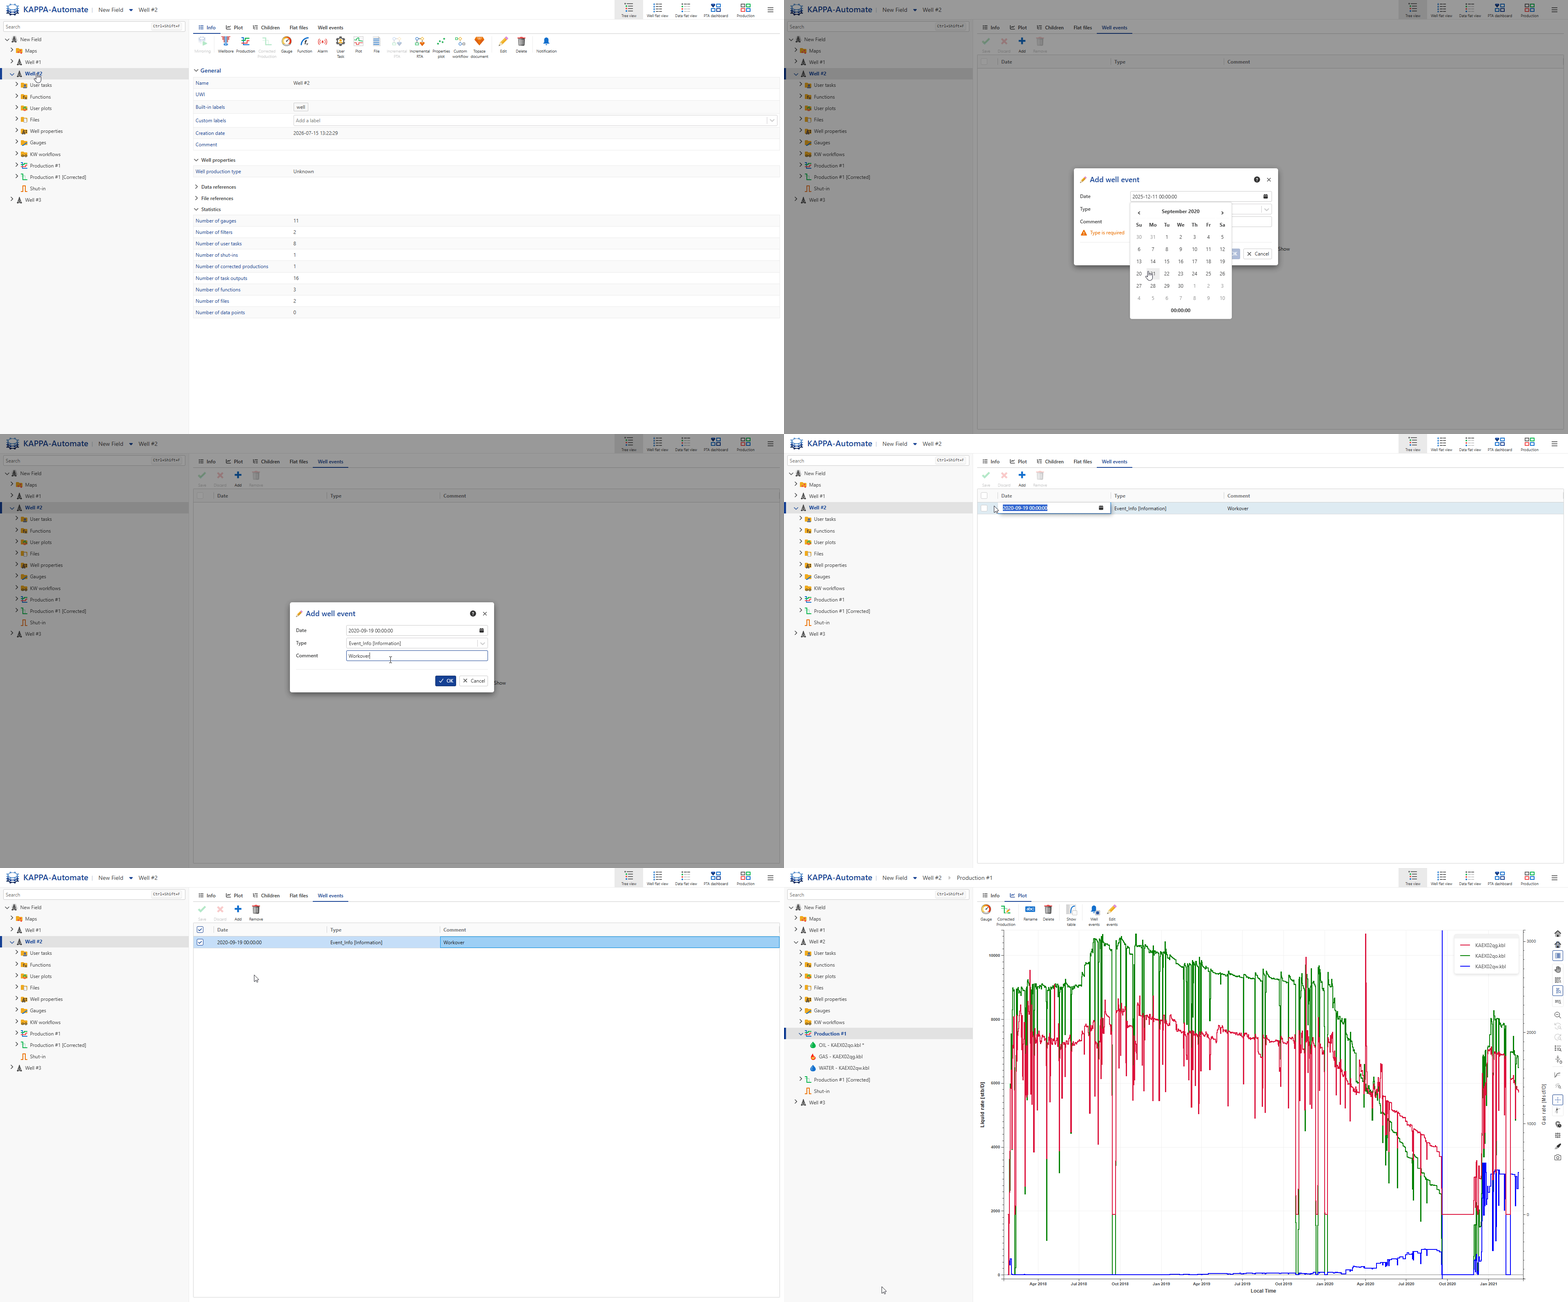
Once the well event is created, the user can display it at any time series gauges by clicking on
 option on the top option ribbon.
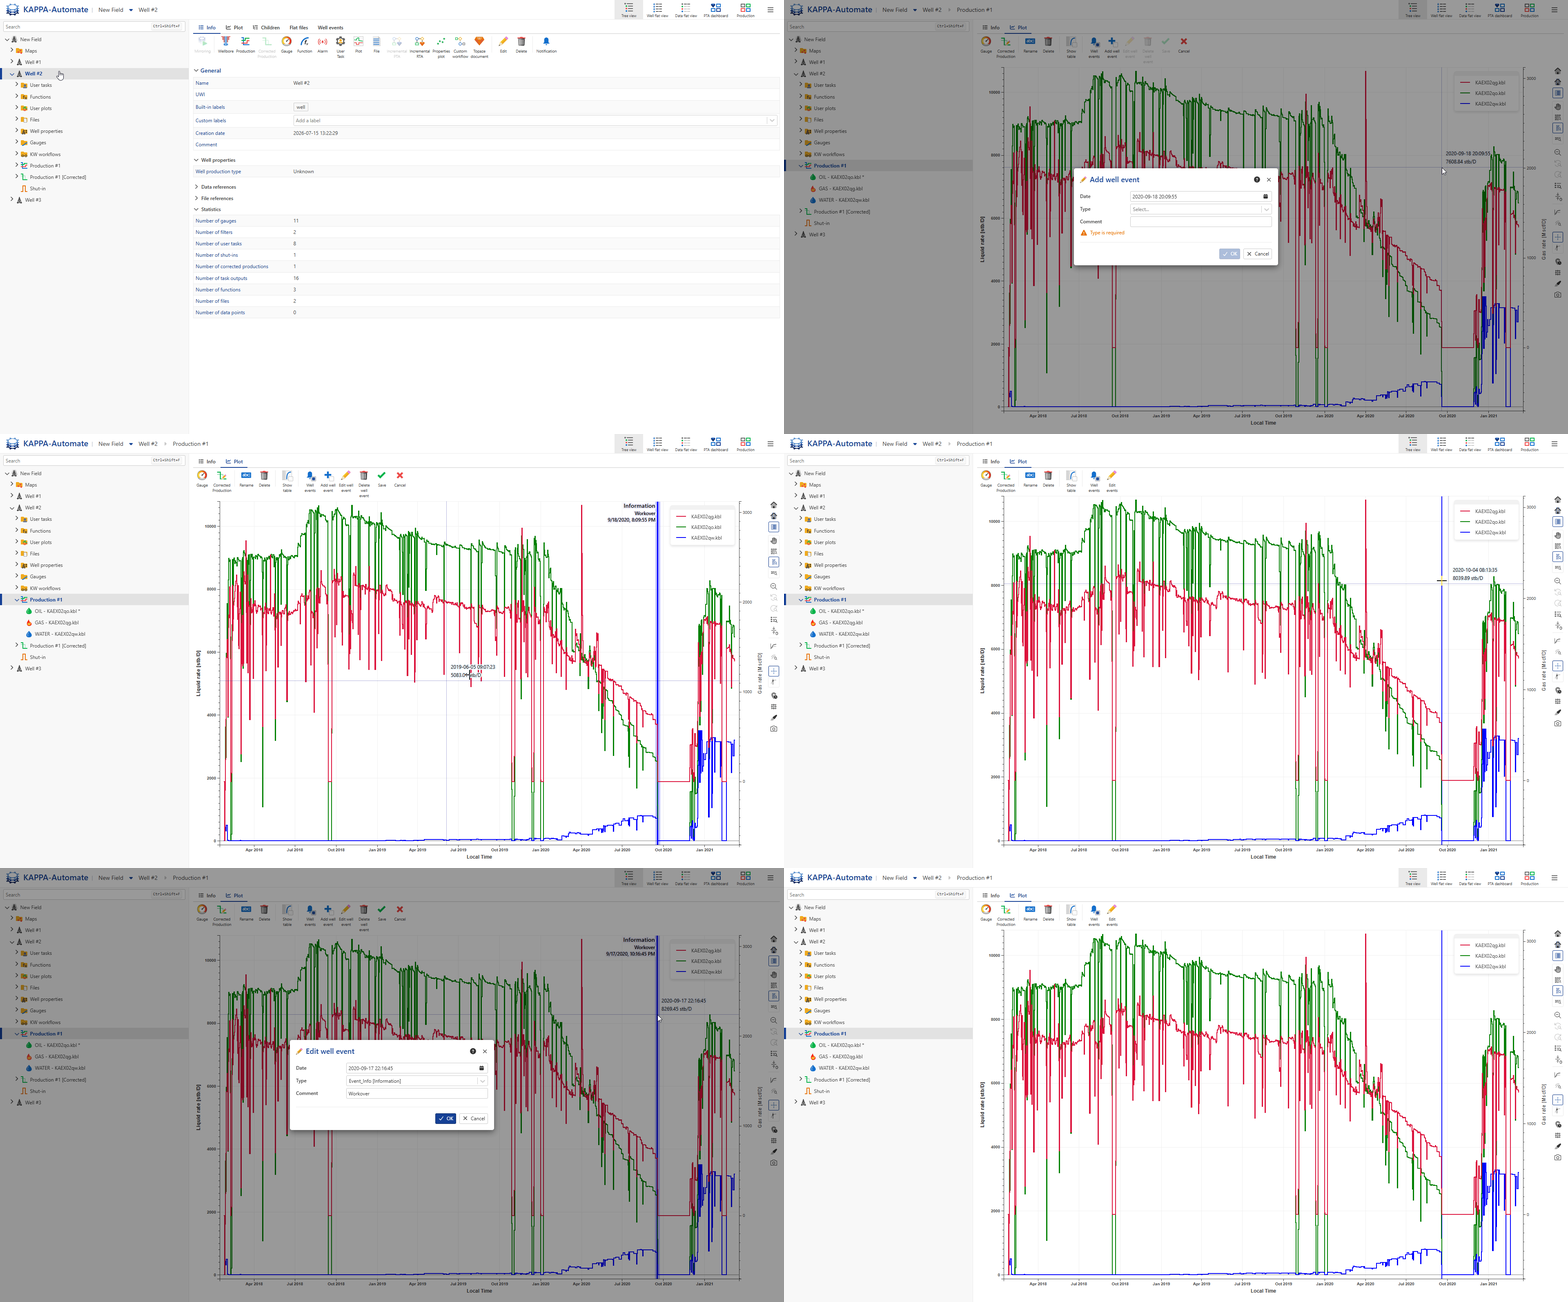
All steps are shown in the .gif below.
Graphically from a time series plot
In plot tab under any times series gauge, click on ,
.Click Edit ,
 .
.Click Add well event
 .
.Move the cursor on the plot to the event date and right‑click.
In the pop‑up dialog, enter:
Date
Type.
Optional. Comments.
Click OK, then choose to Save or Discard using
or respectively.Once created, a well event can be:
Edited by double clicking the vertical slider in the plot.
Deleted by selecting it and clicking
.
All steps are shown in the .gif below.
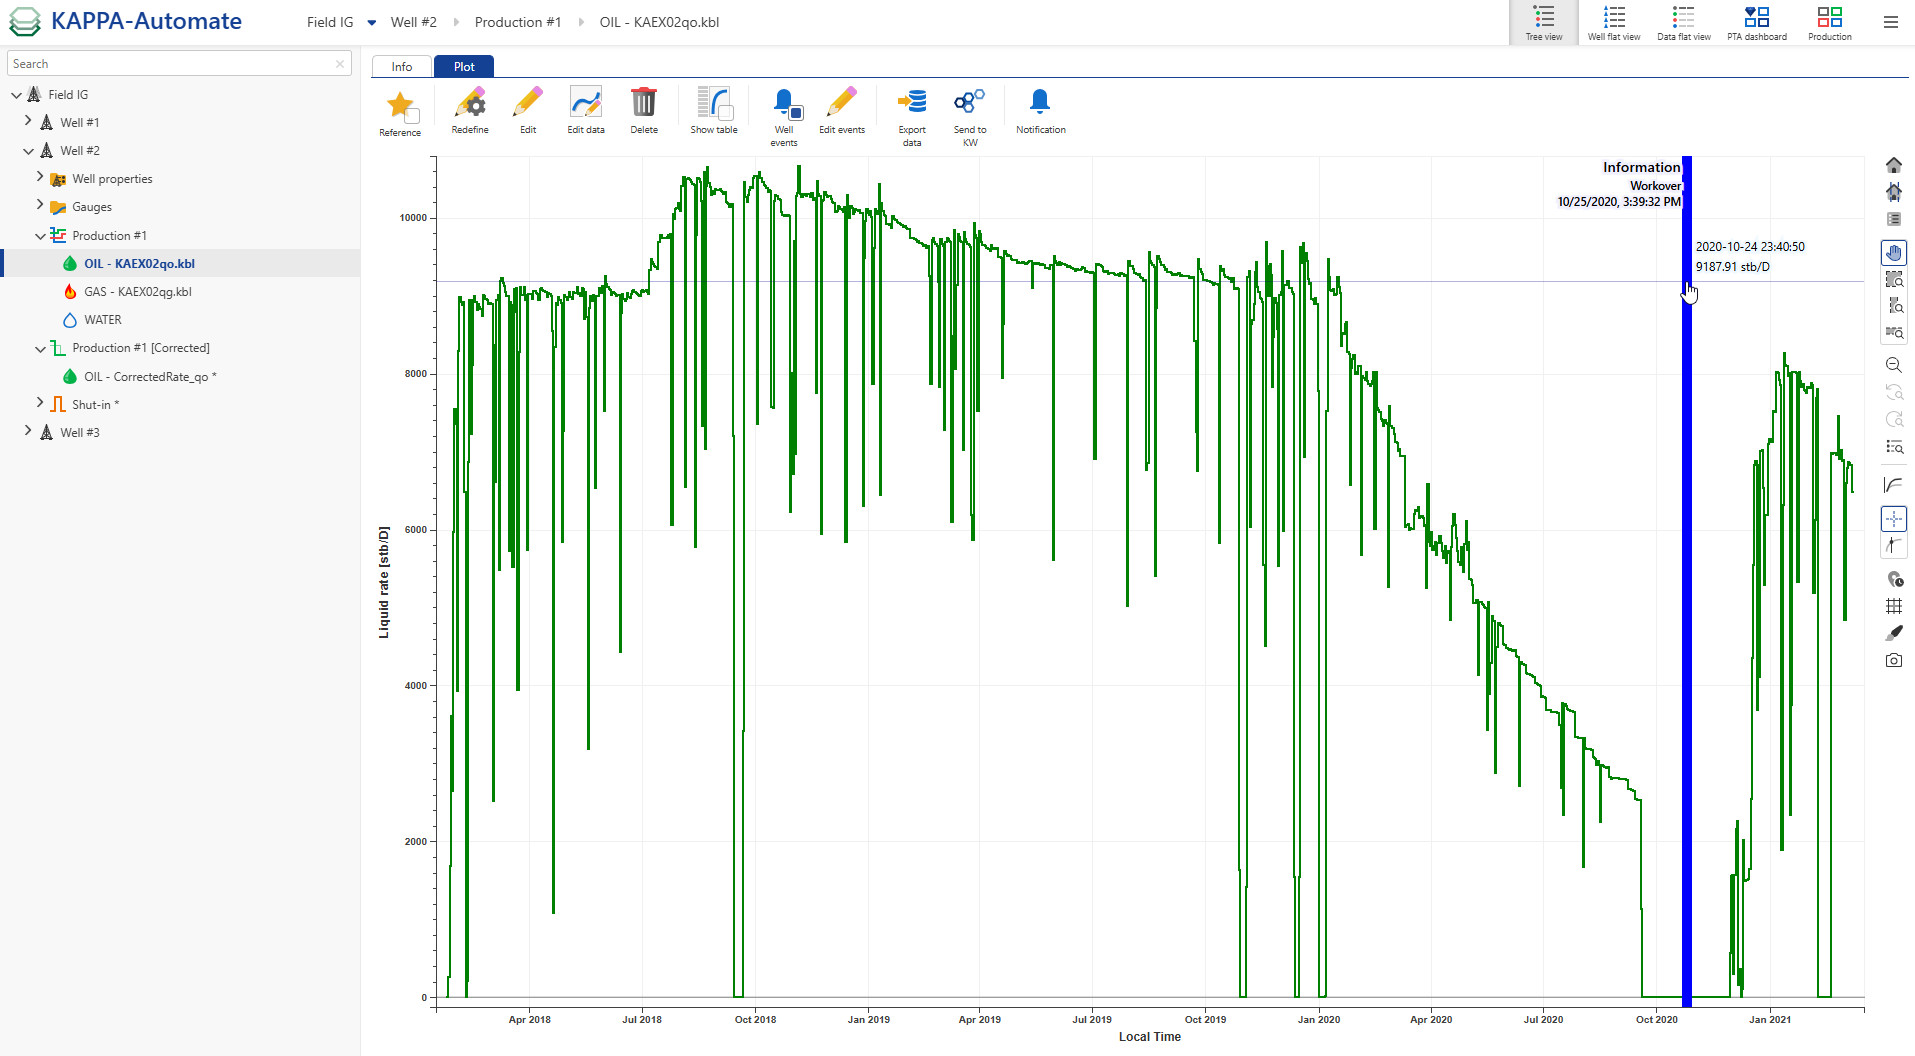
Displaying Well Events on Time Series Gauges
After creating events, users can display them on any time series plot by clicking on option from the top ribbon.
 |