Adding a Filter
When a gauge with high frequency data is loaded, the user will need to clean the data to remove noise on the pressure and to reduce the number of points but keeping relevant events.
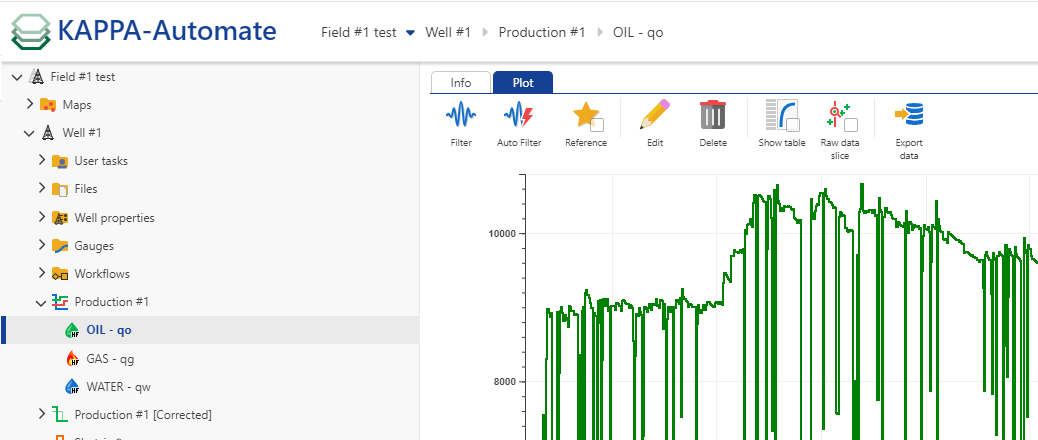
A gauge with high frequency data is present under a well node.
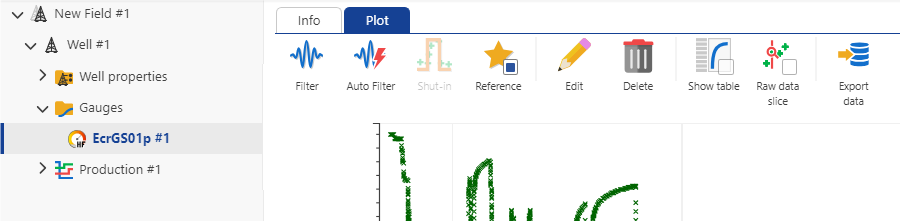
Click on the Gauge node in the Field hierarchy to highlight it. The context ribbon displays all available actions that can be performed on the node. Two Filter setup options are made available to choose from – Filter and Auto Filter.
Click on the Filter,
 , icon to start defining the filtering parameters.
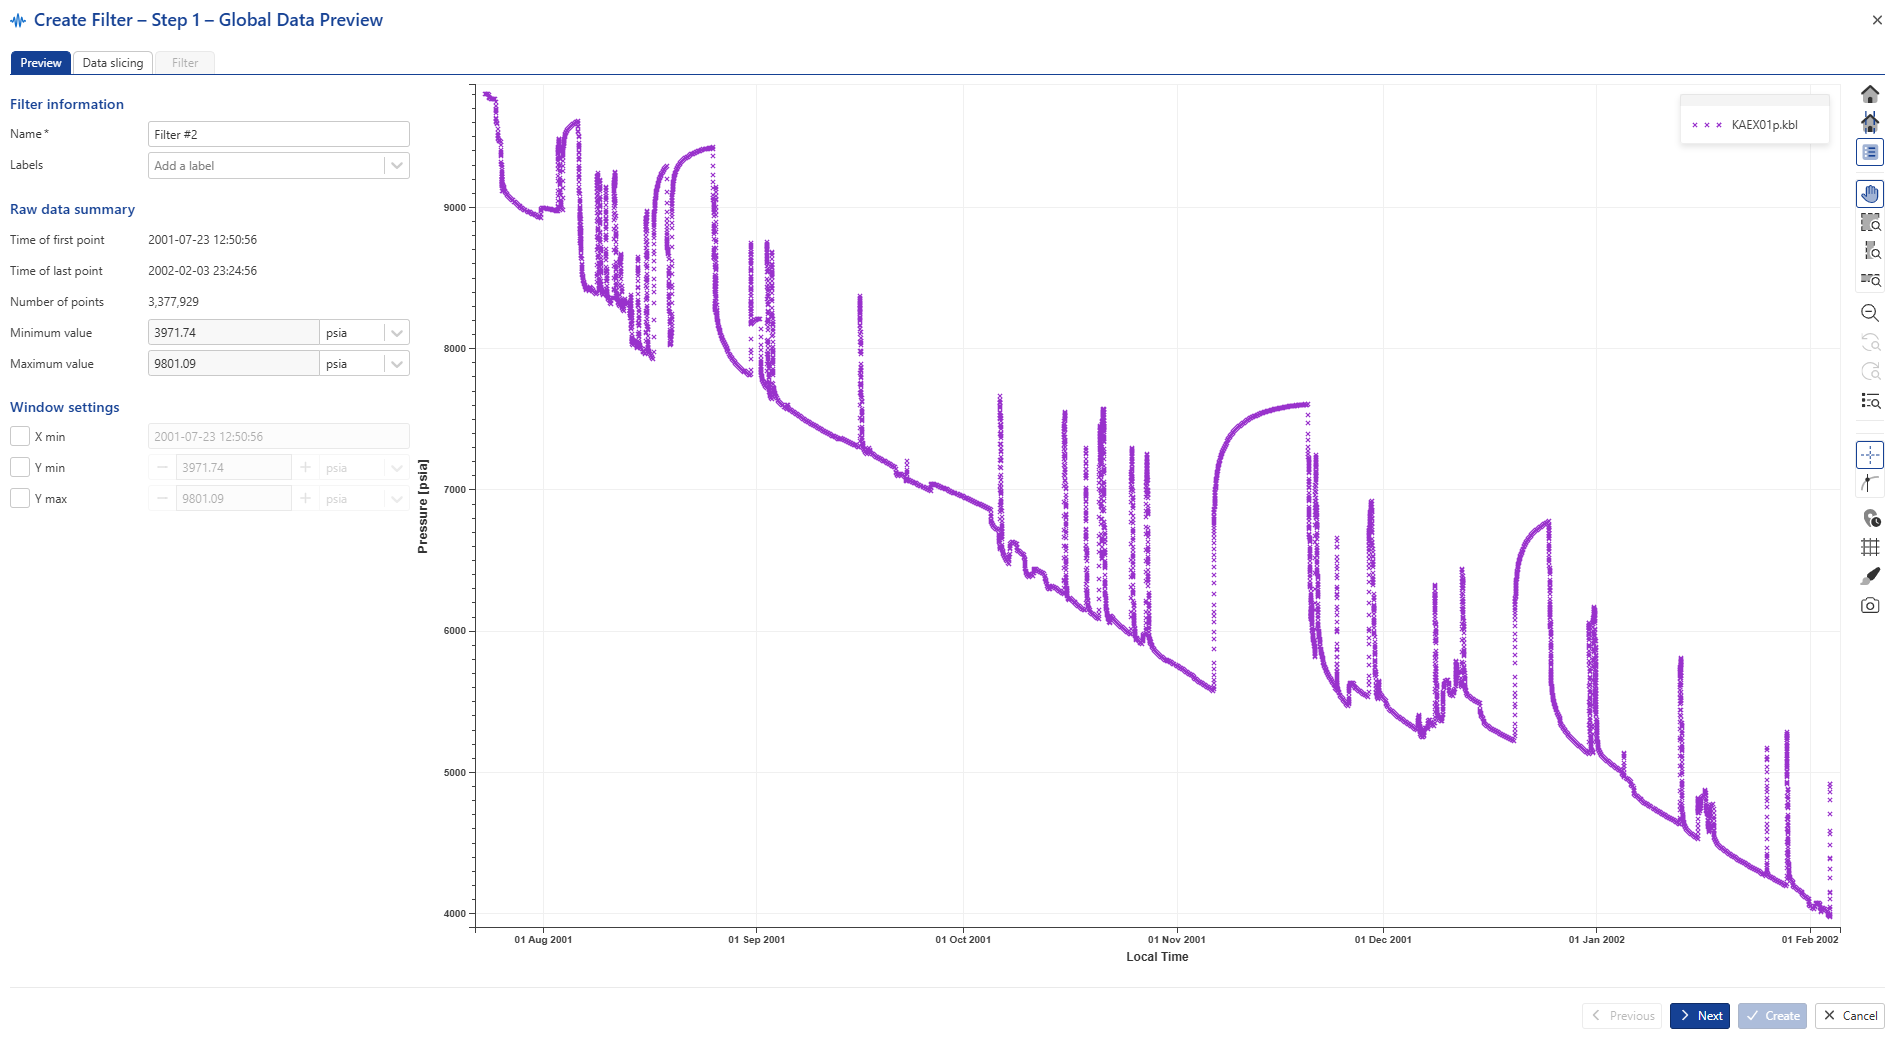
In the Global Data Preview dialog rename the filter if required. Optionally if the data preview displays outliers use the Windows settings, Y min, Y max to exclude error points. X min setting can be used to exclude early time data present in the gauge.
Navigate to the Data slicing tab by clicking on Next. The Data slicing tab shows a preview of the complete gauge in small plot on the left. The red vertical line marks the start of the data slice. The date and time are displayed in the Time of first point field under the Slice settings panel. The end of the data slice is controlled by the Size of slice parameter allowing a minimum of 1000 points. Data points in the slice are shown on the large plot to the right. This plot shows all the raw data points in the slice.
In the interactive plot preview (on the left below), input a date in the Time of first point field or select a data slice. Hover over the vertical red line until it changes to blue then click, hold and drag the line to a new position in time. Once the line is released a slice of raw data is fetched.
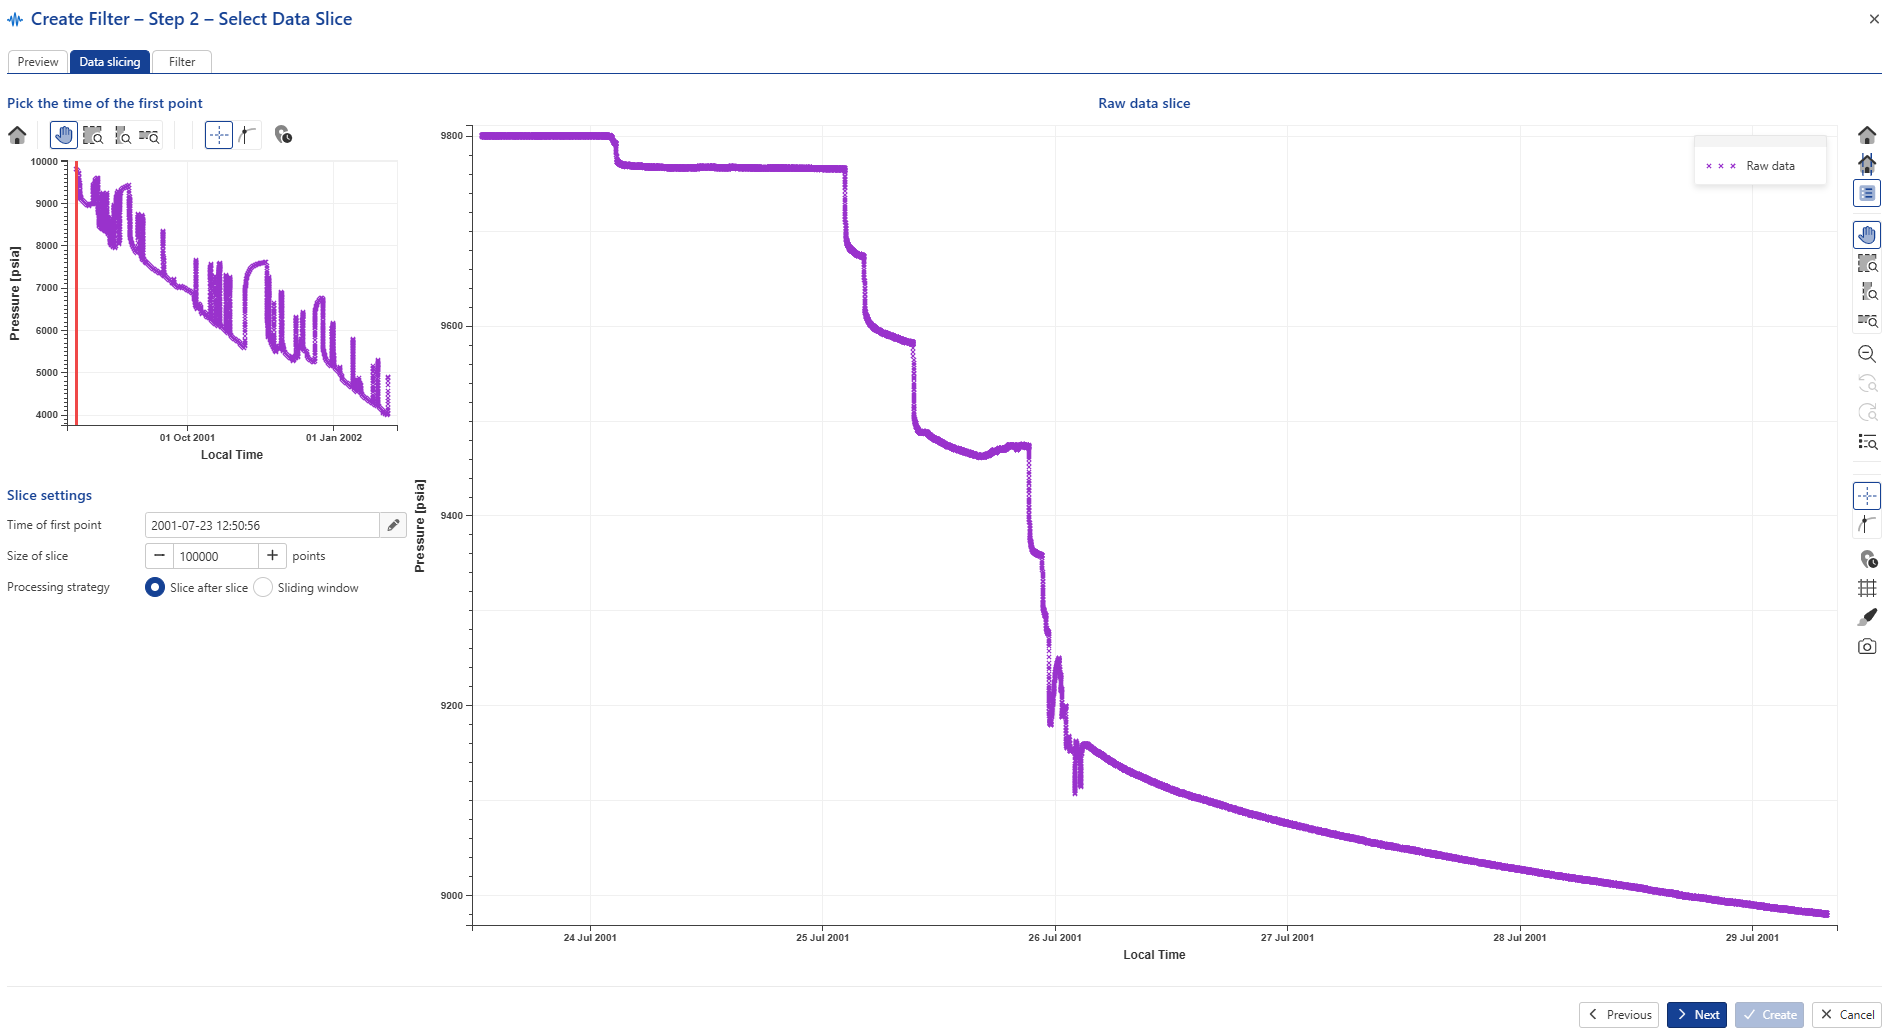
Procced with Next.
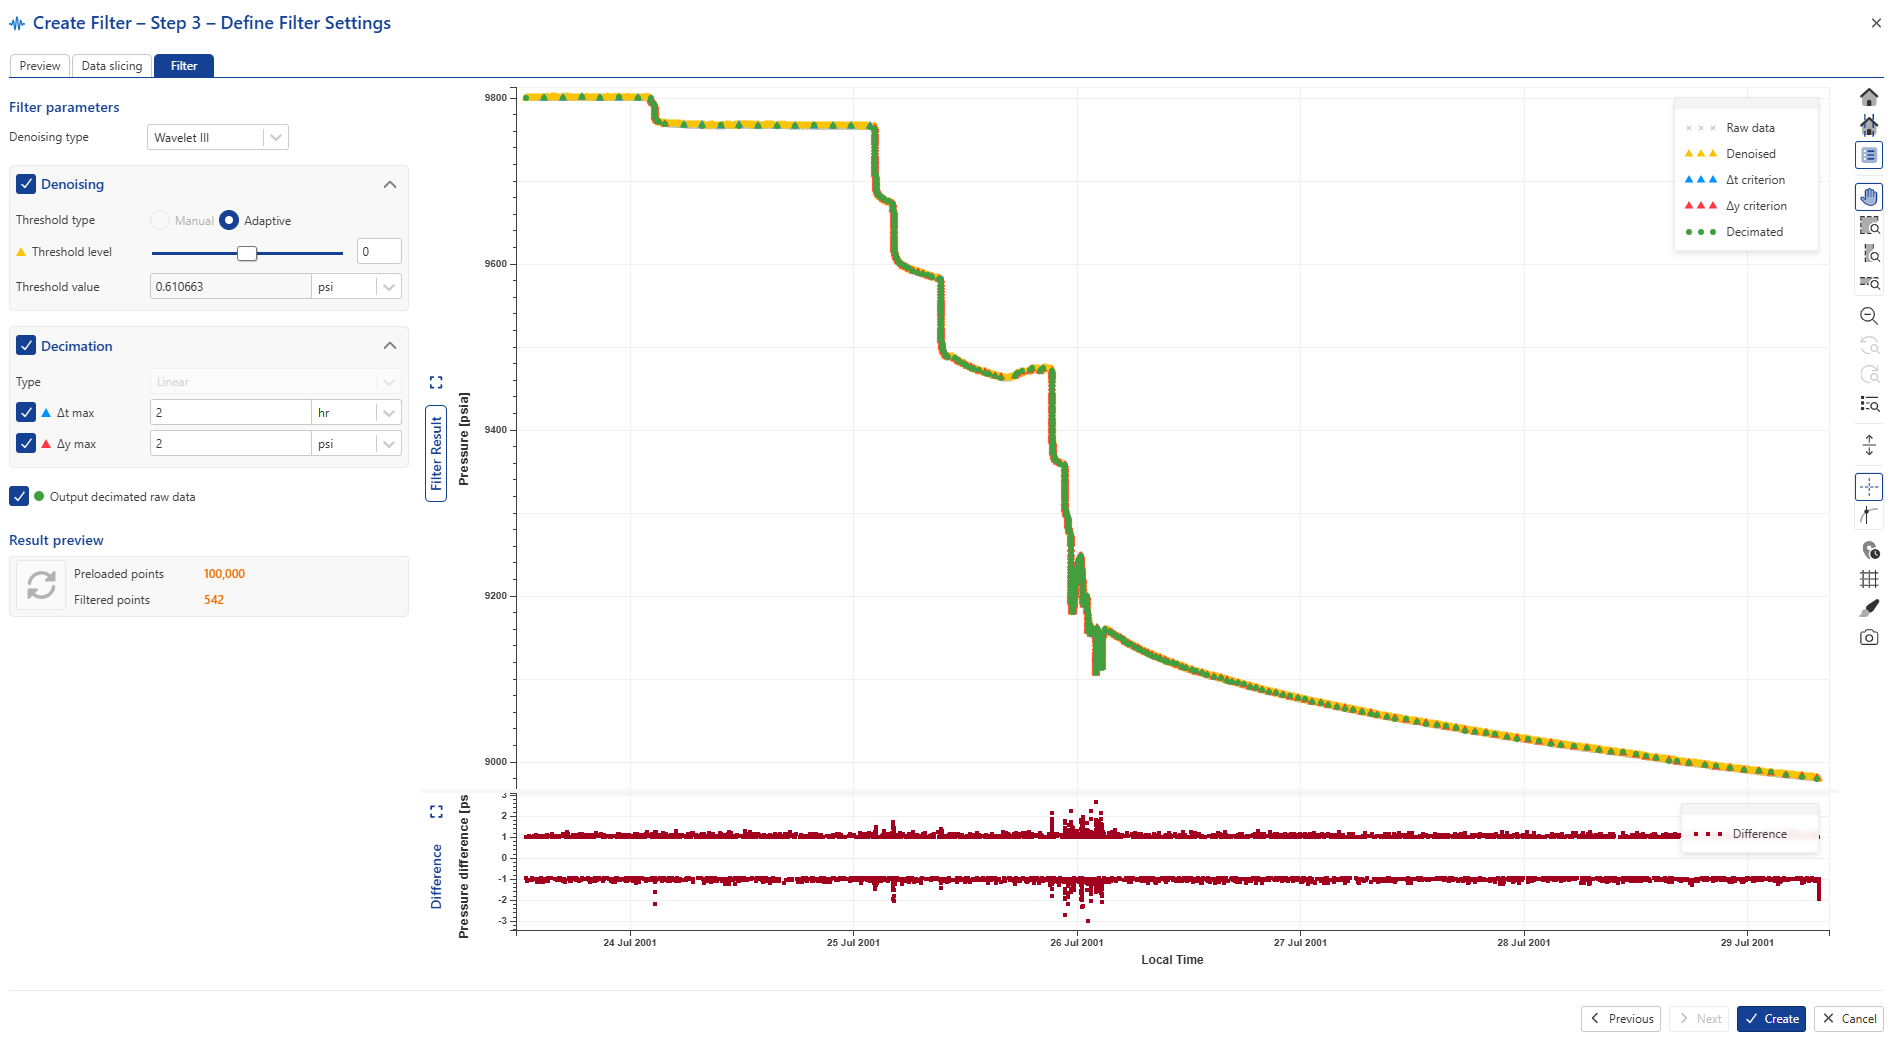
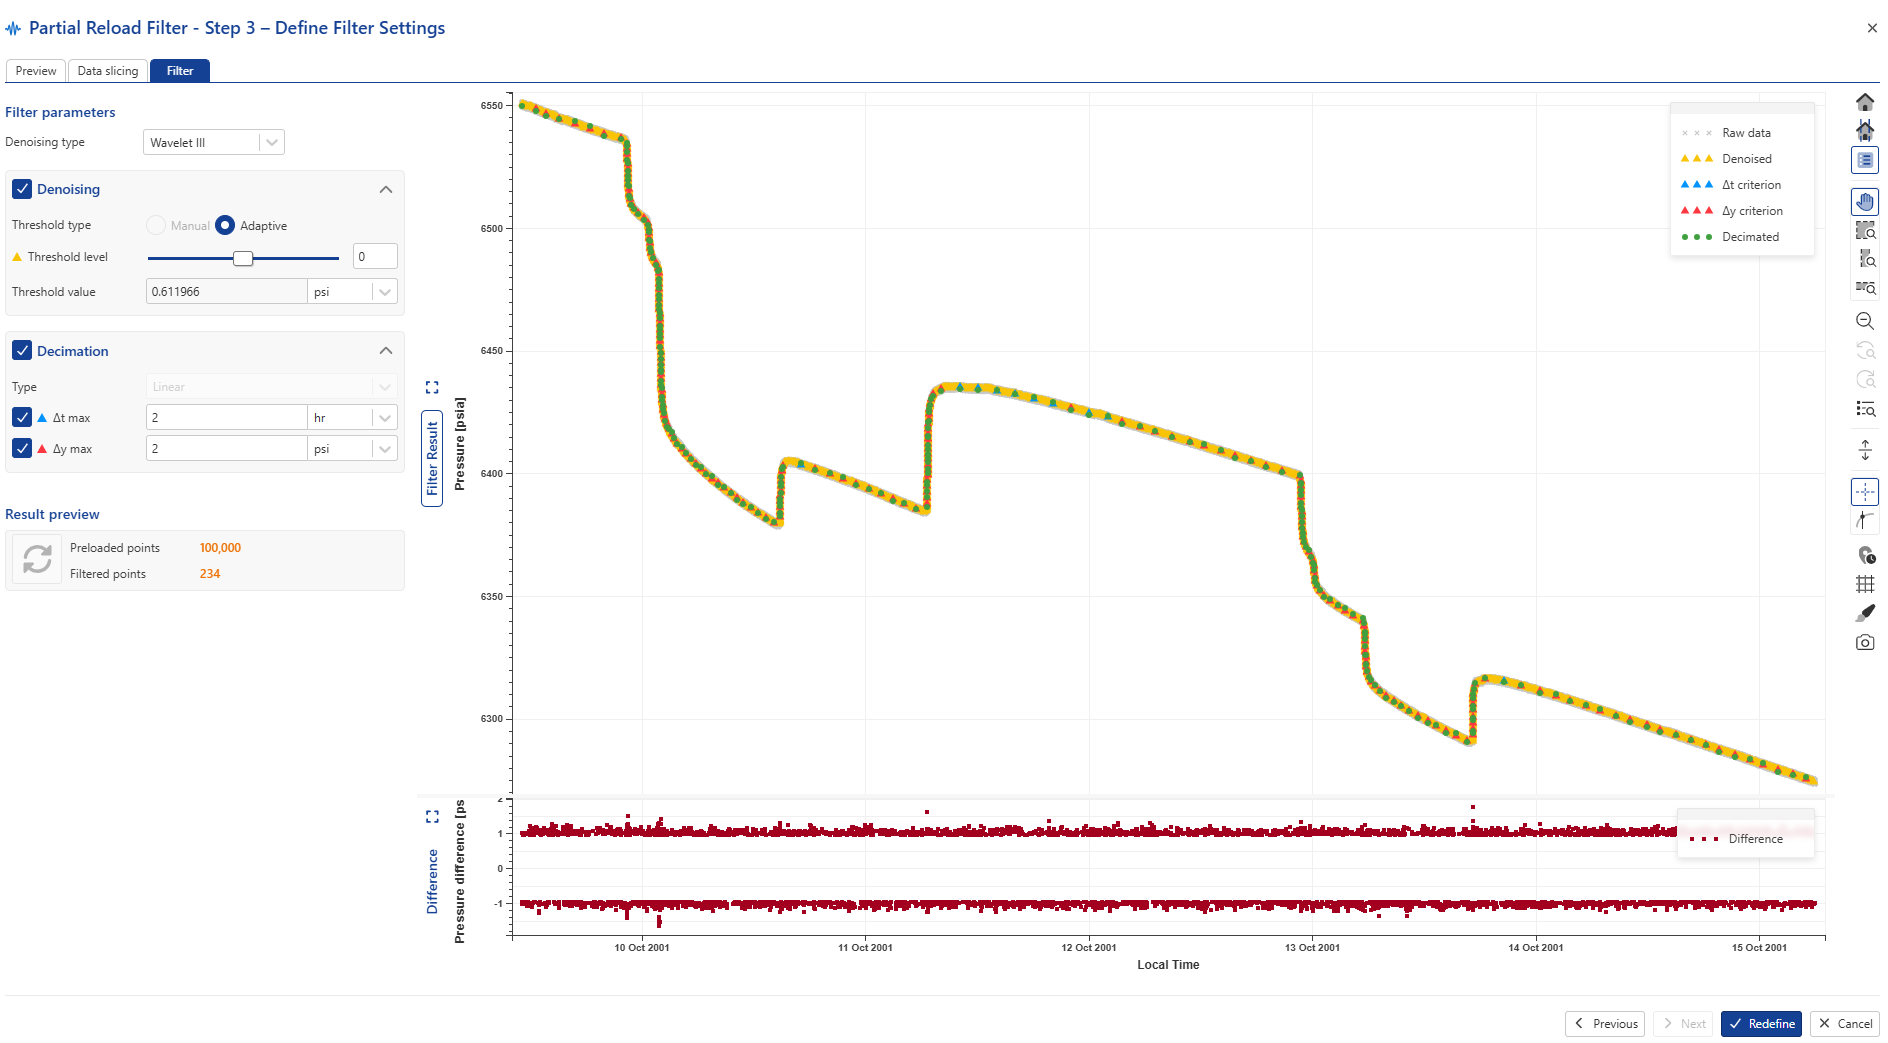
The denoising results are displayed on the plot with zoom options. Raw data points are represented in grey, while the denoised data in yellow. The first step in setting filtering parameters is to select appropriate Denoising parameters. The Threshold level can be used to adjust denoising level.
Set the required decimation criterium using the ∆t max and/or ∆y max parameters.
∆t max — maximum time between points if the 'delta y' value for them is less than the delta max. Default value set to 2 hours.
∆y max — maximum 'delta y' value between consecutive points. For rates data 'delta y' max is set to 10 stb/d, for pressure data delta y max is set to max (2psi, threshold value).
These settings work together to produce a filter result that would honor slow changing data with fewer points and fast changing data with a more detail point representation.
Optional. Set whether decimated raw data should be output in addition to the filtered data by checking Output decimated raw data.
The option is available with Wavelet II and Wavelet III. When set the filtration processes create an additional filtered data set with raw data points, i.e. the data points retain their original values without any changes due to the denoising algorithm.
Note
If left unchecked when creating a filter, it may be output later by selecting the filter in the field hierarchy and clicking in Decimated raw,
 , in the ribbon at the top.
Click on Filter preload slice to update the changes
 . The filter results for the slice are shown below. Preloaded points – is the size of the slice of raw data; Filtered points is the result after applying the settings above on the raw slice of data.
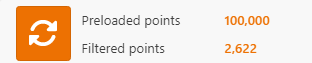
Click on Create to finalize the filter settings and instruct K-A to apply them to all the data in the gauge as well as any new data loaded onto the gauge in future.
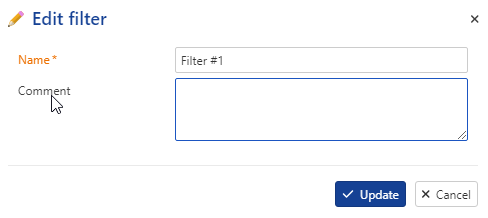
Optional. Once the filter is created, the user can edit the comments.
Partial Filtering Redefinition
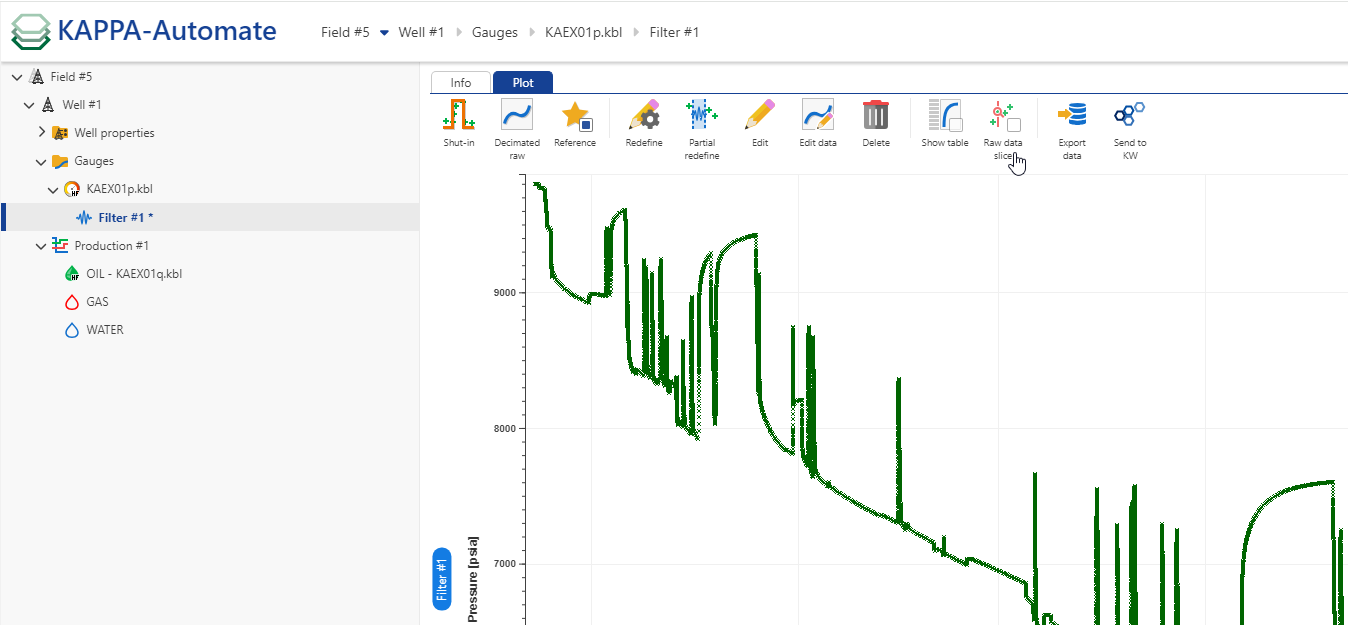
It is possible to partially redefine a filter within a specified time range by selecting a filtered data node and by clicking on the Partial redefine, , option. This will show a highlighted range on the plot, which can be edited by moving the solid vertical lines at each end:
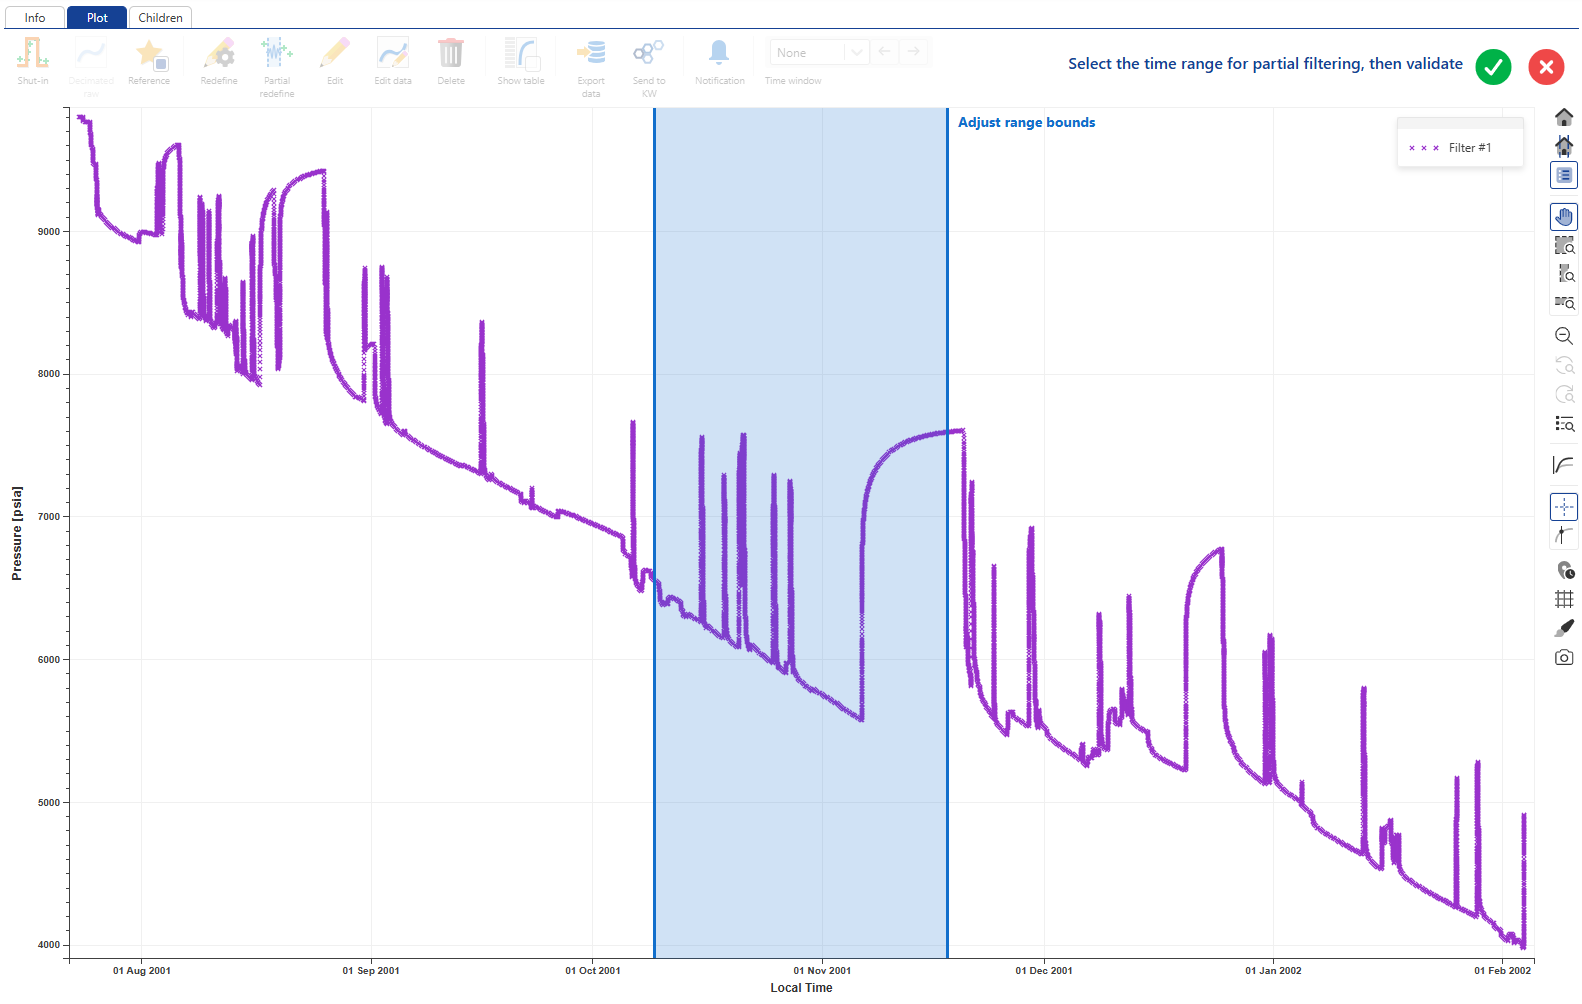 |
Once the range is adjusted as required, the user clicks on  to validate the selection and access the filtration dialog where the filter settings can be updated.
 |
Note
It is possible also to filter high-frequency production data. This allows denoising and reducing high- frequency production data volumes to the necessary level for a given application and also allows them to be used in built-in workflows, functions and user tasks. The option is accessible within Info/Plot tab
 |
Filter preview display
The raw data is replaced by a preview in the display. This is designed to handle cases where filters include a large number of points, such as in small decimations. The option to view the original raw data is available through the option  , in the ‘plot’ tab within the ‘Well’ node.
 |
Redefining a Filter
To redefine filter:
Select the filter node on the field hierarchy.
Click on Redefine ,
 , at the top under the Plot or Info tab.
This will take you to the page where you can edit and redefine filter settings
Note
You will notice that the current settings are preserved.
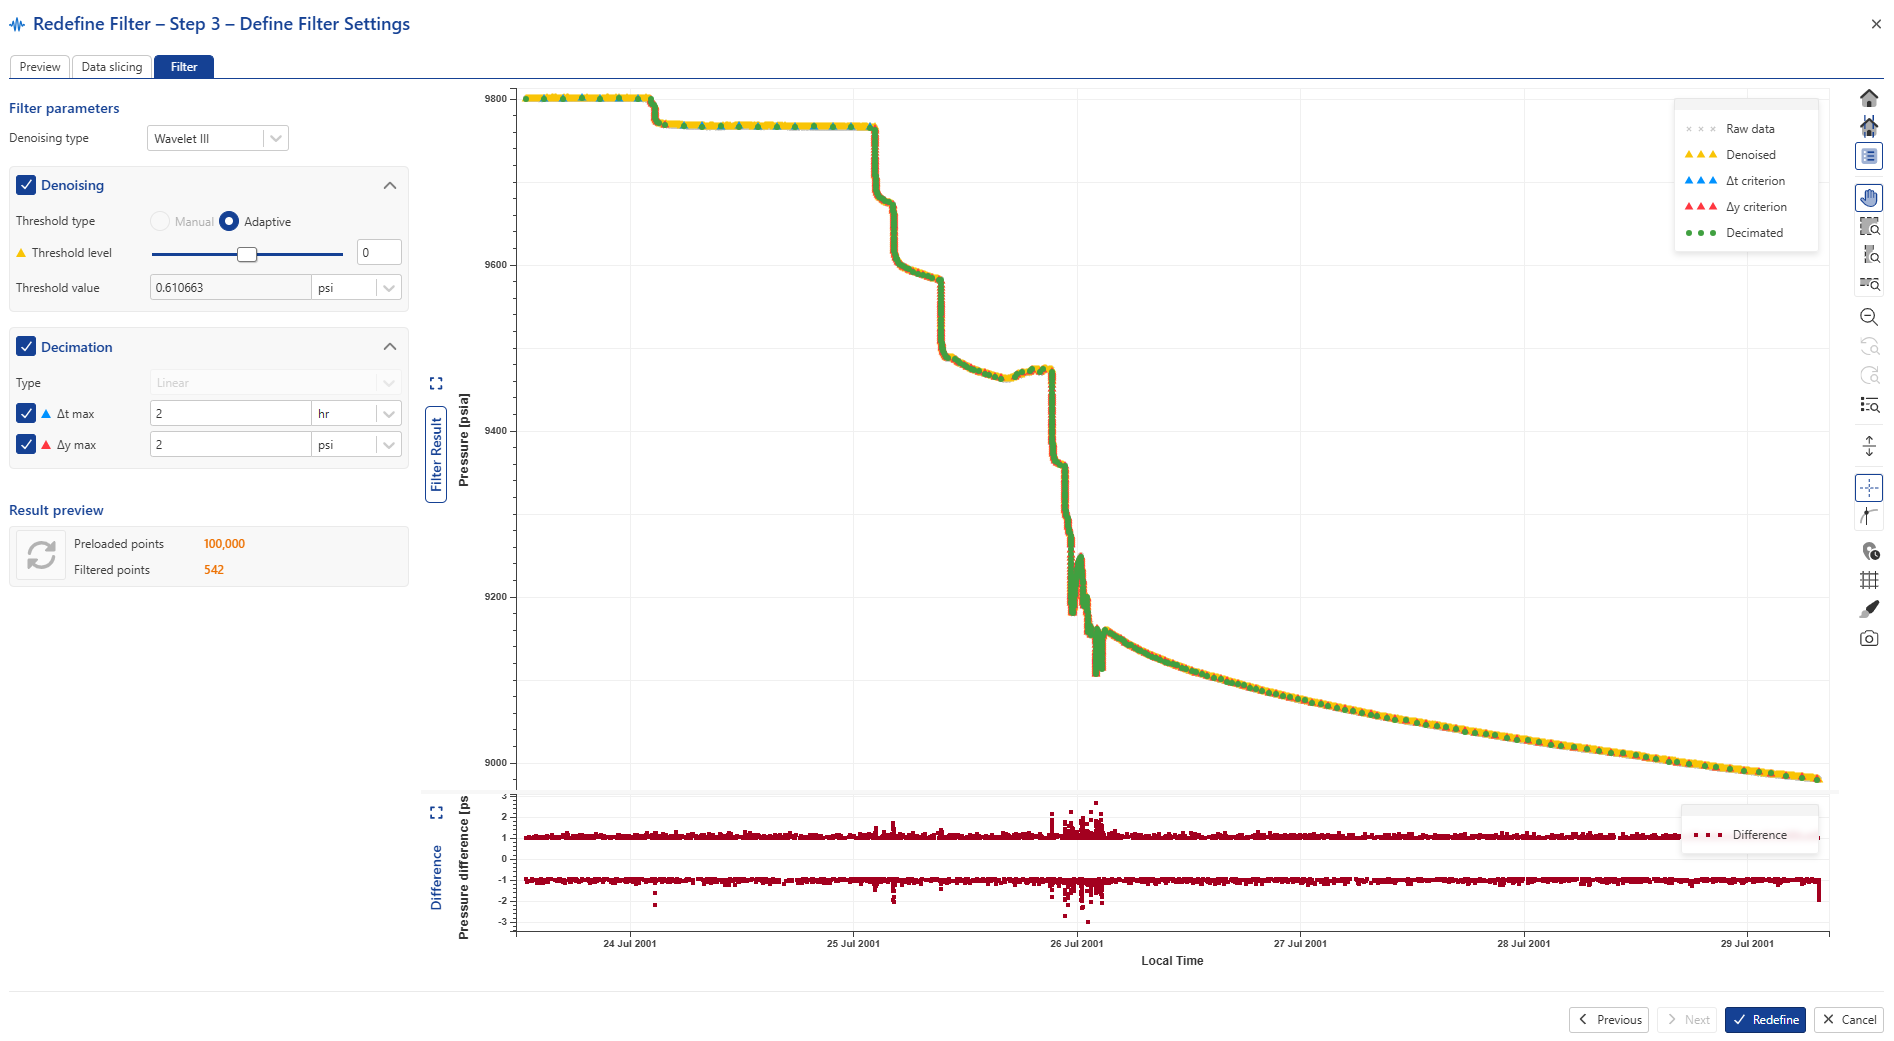
Redefine the filter settings as needed.
Click on Redefine.