Gauges
A gauge is typically a mirror of a tag in a data source (historian or database). A gauge is typed precisely; and for instance, a particular pressure time series could be loaded as simply ‘Pressure’ or more strongly typed as ‘Bottom-hole pressure’, ‘Casing pressure’ etc. Typing is important as it will help automated processes select the proper input. Besides the data type, a gauge can be recognized/defined as High-frequency (HF) or Low-frequency (LF). The choice will determine access to filtering as direct processing of HF data in the platform is usually not allowed and filtering is necessary. When there are several instances of the same data type, it is possible to flag one as the reference. Once again this will guide automatic selection.
High and Low-Frequency Gauges
At load time, KAPPA-Automate treats any source gauge with more than 100,000 points as high-frequency. This is denoted by the High frequency flag in Step 2 of the gauge loading process:
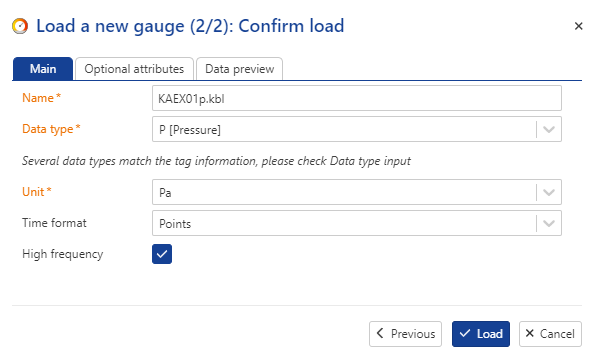
Note
By default data loaded under the Gauge folder are considered to be high frequency point data, whereas production data loaded under a Production container are assumed to be low frequency step data.
Data preview tab of the gauge loading dialog allows checking the data to confirm the data frequency and change the parameter if the default settings are not appropriate.
Note
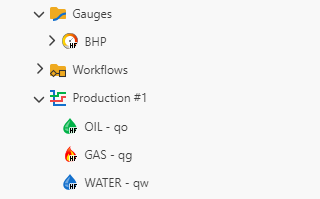
A high frequency marker is introduced in tree view to distinguish high-frequency data from low-frequency items, providing enhanced visibility and differentiation between the two.
 |
Users may manually uncheck this flag (usually not recommended) if they only wish to load part of the gauge with less than 100,000 points. However, as the gauge is updated with new data, as soon as the total number of points exceeds 100,000, KAPPA-Automate will automatically flag the gauge as high-frequency. This may have consequences on any workflows using this gauge.
For any gauge with less than 100,000 points users can manually check this flag, if they envision that the gauge will eventually grow to have more than 100,000 points.
When dealing with high-frequency gauges, it is recommended not to use the raw gauges directly but filter them to the necessary level for a particular application. In fact, certain built-in workflows in KAPPA-Automate like Shut-In Identification, iPTA and iRTA etc., do no accept raw high frequency gauges as input. It is also not possible to transfer high frequency gauges to KAPPA-Workstation. Additionally, high-frequency gauges cannot be edited inside K-A.
For low-frequency gauges, filtering is not available. They can be used directly inside any workflow. Low-frequency gauges may also be edited
Gauge Preview
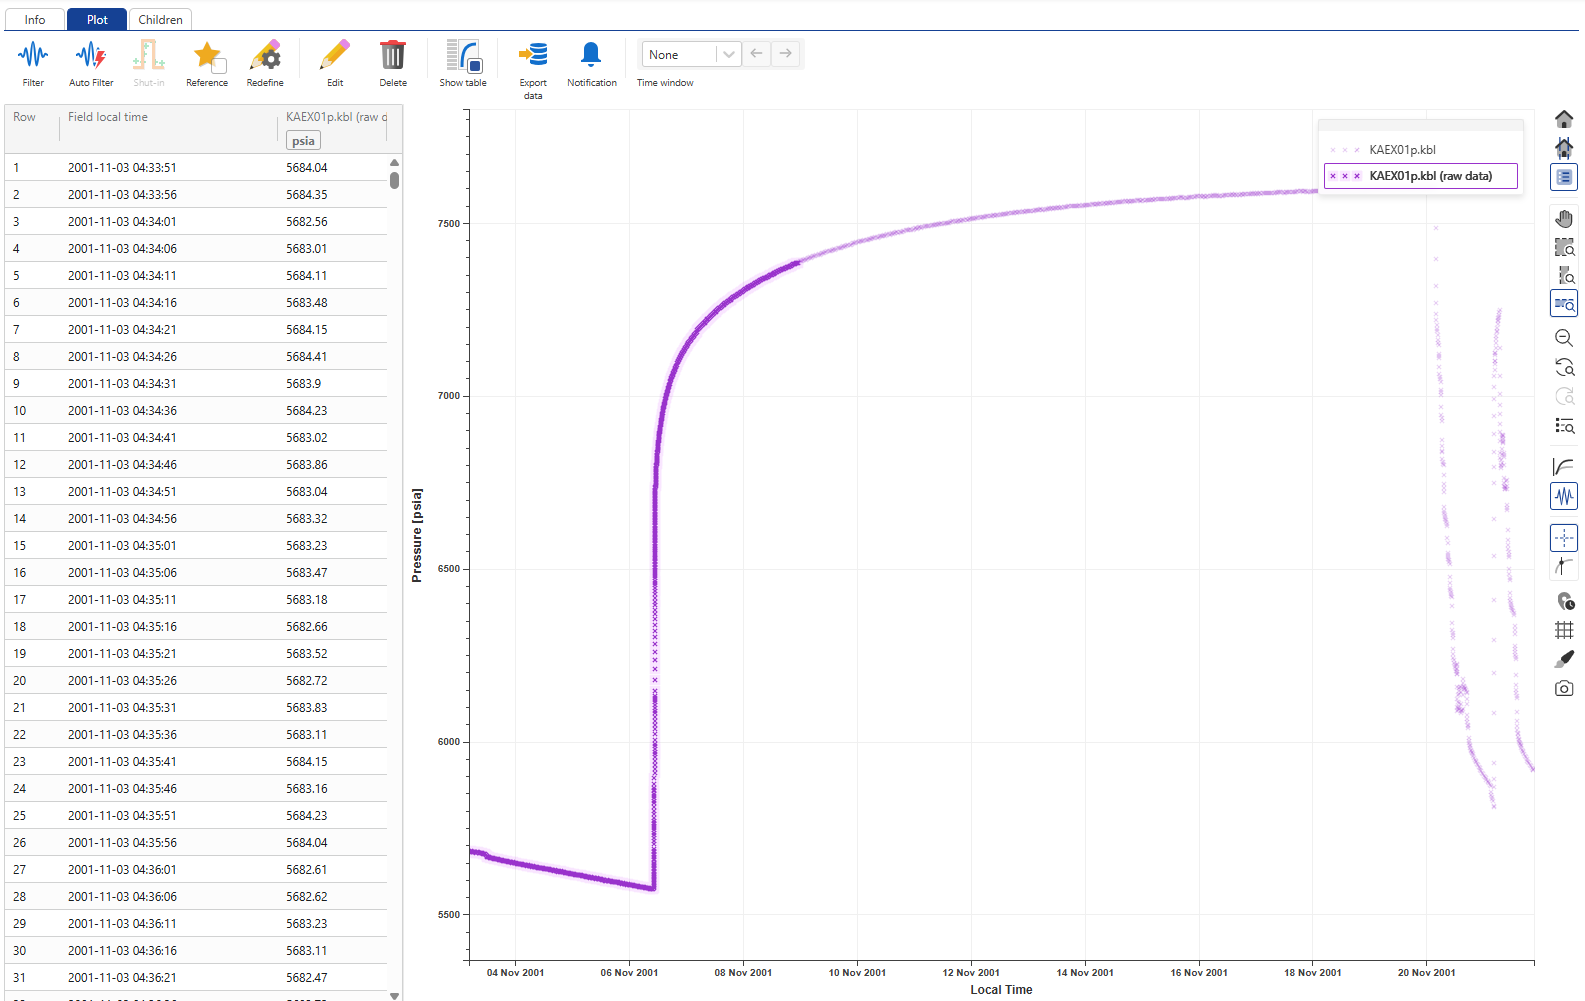
When loaded, the plot for a high frequency gauge does not show all gauge data. Only a representative preview of the full gauge is shown on the contextual plot. However, it is possible to show a slice (of 100,000 points) of the raw gauge data on the plot. To do so:
Select the high frequency gauge in the field hierarchy.
Switch to the Plot tab.
Zoom around area of interest and enable Raw data slice,
 to the right of the plot.
The plot is updated and 100'000 points of the raw gauge data are highlighted on the plot starting from the left side of the window.
Zoom in/out of the plot or move an existing selection window on the data to see the raw data in the updated selection window.
As soon as the highlighted raw data slice is not adopted by the window, KA starts processing the gauge to show another slice of 100,000 points of the raw data.
Note
To see the data values, click on Show table,
 .
.
Note
To remove the table, click on Show table,
 , again.
Once done, click on
 and
and  to the right of the plot to restore the view.
Point and Step Data
A gauge can have data stored as points or steps. Points relate to the instantaneous value of a measure and commonly include measurements like Pressure and Temperature. Step data are values averaged over a time duration. This typically includes production rates. Both of these data can be handled inside K-A.
Although step data are traditionally considered low-frequency, they may also be loaded as high-frequency inside K-A.
If fata are loaded as points and high-frequency, the Integral Filter can be used to generate a filtered gauge.
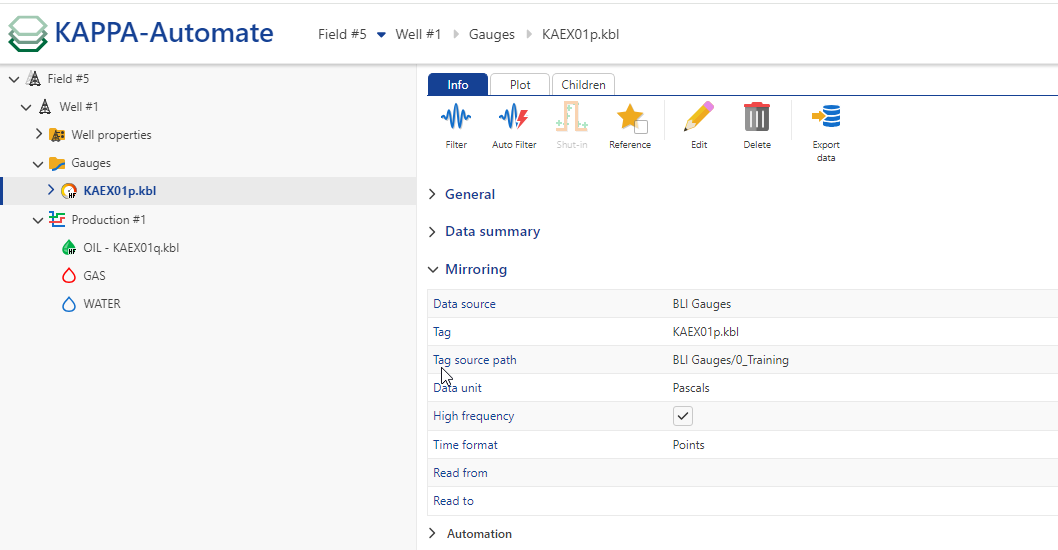
Tag source path
To inform/remind users about the source of data, the tag source path is displayed under the info tab within gauges/ production.
 |
Data sources from previous tags are now saved per well or well group.