Adding a Gauge to a Well
Wells can have two different types of data: (1) gauges – i.e. time series of many different types and (2) well properties, aka well static properties. When they are high frequency, gauges are filtered for further processing. Well properties can cover multiple types and they are also potentially time series. They can be used to define static properties or to hold analyses results.
Select a well by clicking on the Well icon in the field hierarchy.
The context menu will display an icon list of all available actions that can be performed on the well node as illustrated below:
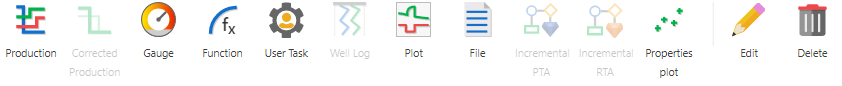
Click on Gauge,
 . A Load new gauge dialog is displayed. Navigate to the required data source node:
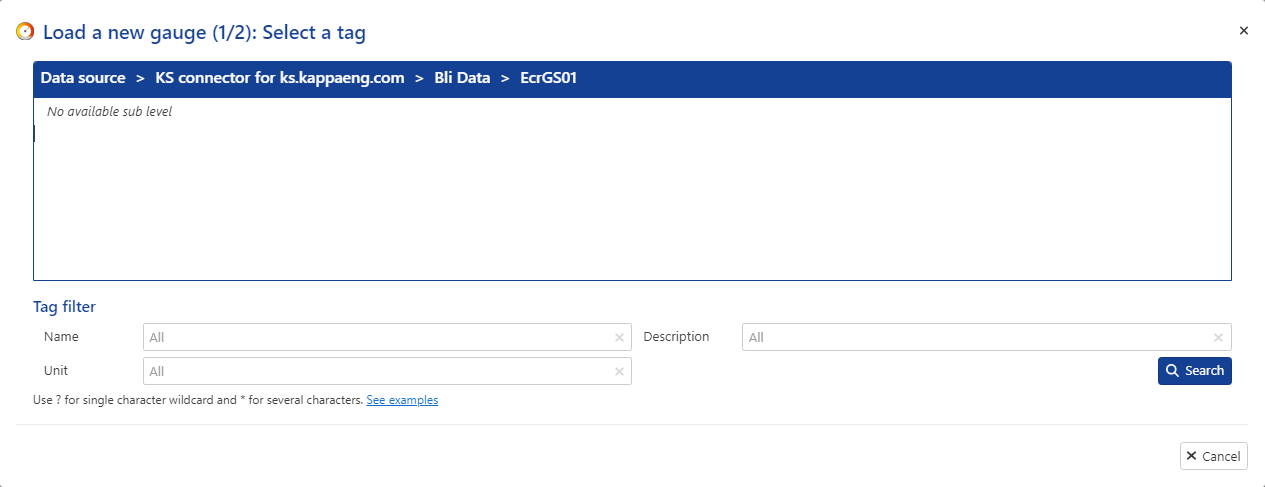
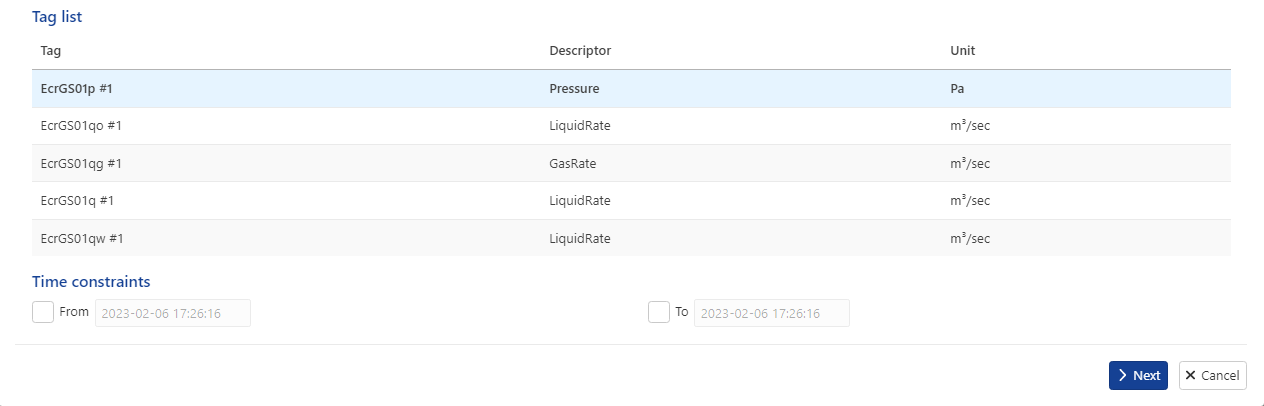
Click on the Search button to fetch the list of tags available under the data source node. Select a Tag from the provided list and proceed with the Next button.
In the Load confirmation page, review the preselected Data type and Unit. Change them if required to match to the unit and or data type provided by the data source.
Warning
If the unit is wrongly matched then K-A would incorrectly process the data.
Note
Gauge Data type and HF flag can be edited after the data have been loaded (see Data Types for details).
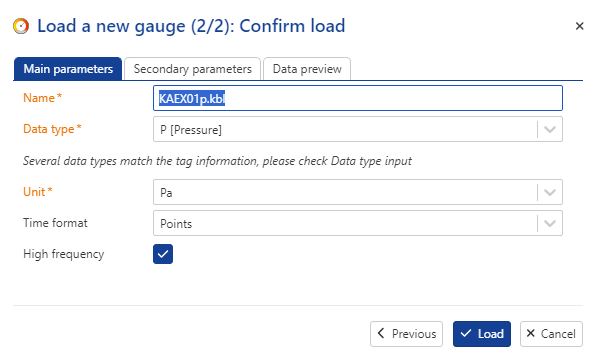
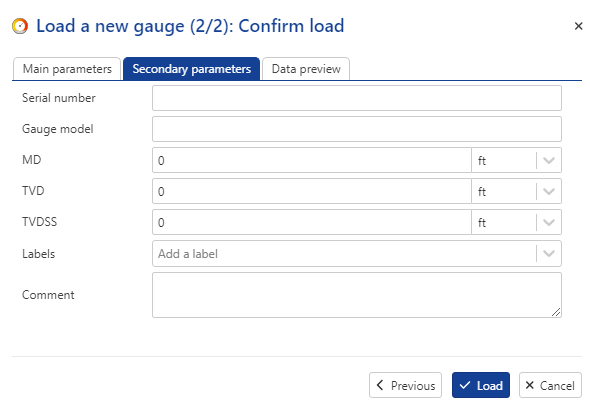
Additional gauge attributes like Depth, Serial Number, Gauge Model can be added if required by switching to the secondary parameters dialog.
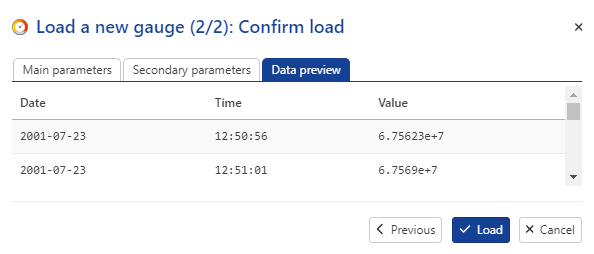
Use the data preview to assess if the tag contains high frequency data. As an approximation high frequency data can have values at intervals less than 15 minutes and would require filtering. A pressure gauge with readings every 5 seconds is considered as a high frequency data, while an allocated daily production is a low frequency data.
Note
If High frequency checkbox is not set then the data is considered by K-A as Low frequency data and the available time formats to select from are — Points, Time at Start and Time at End. The last two options represent step data and are usually used to load allocated production rates.
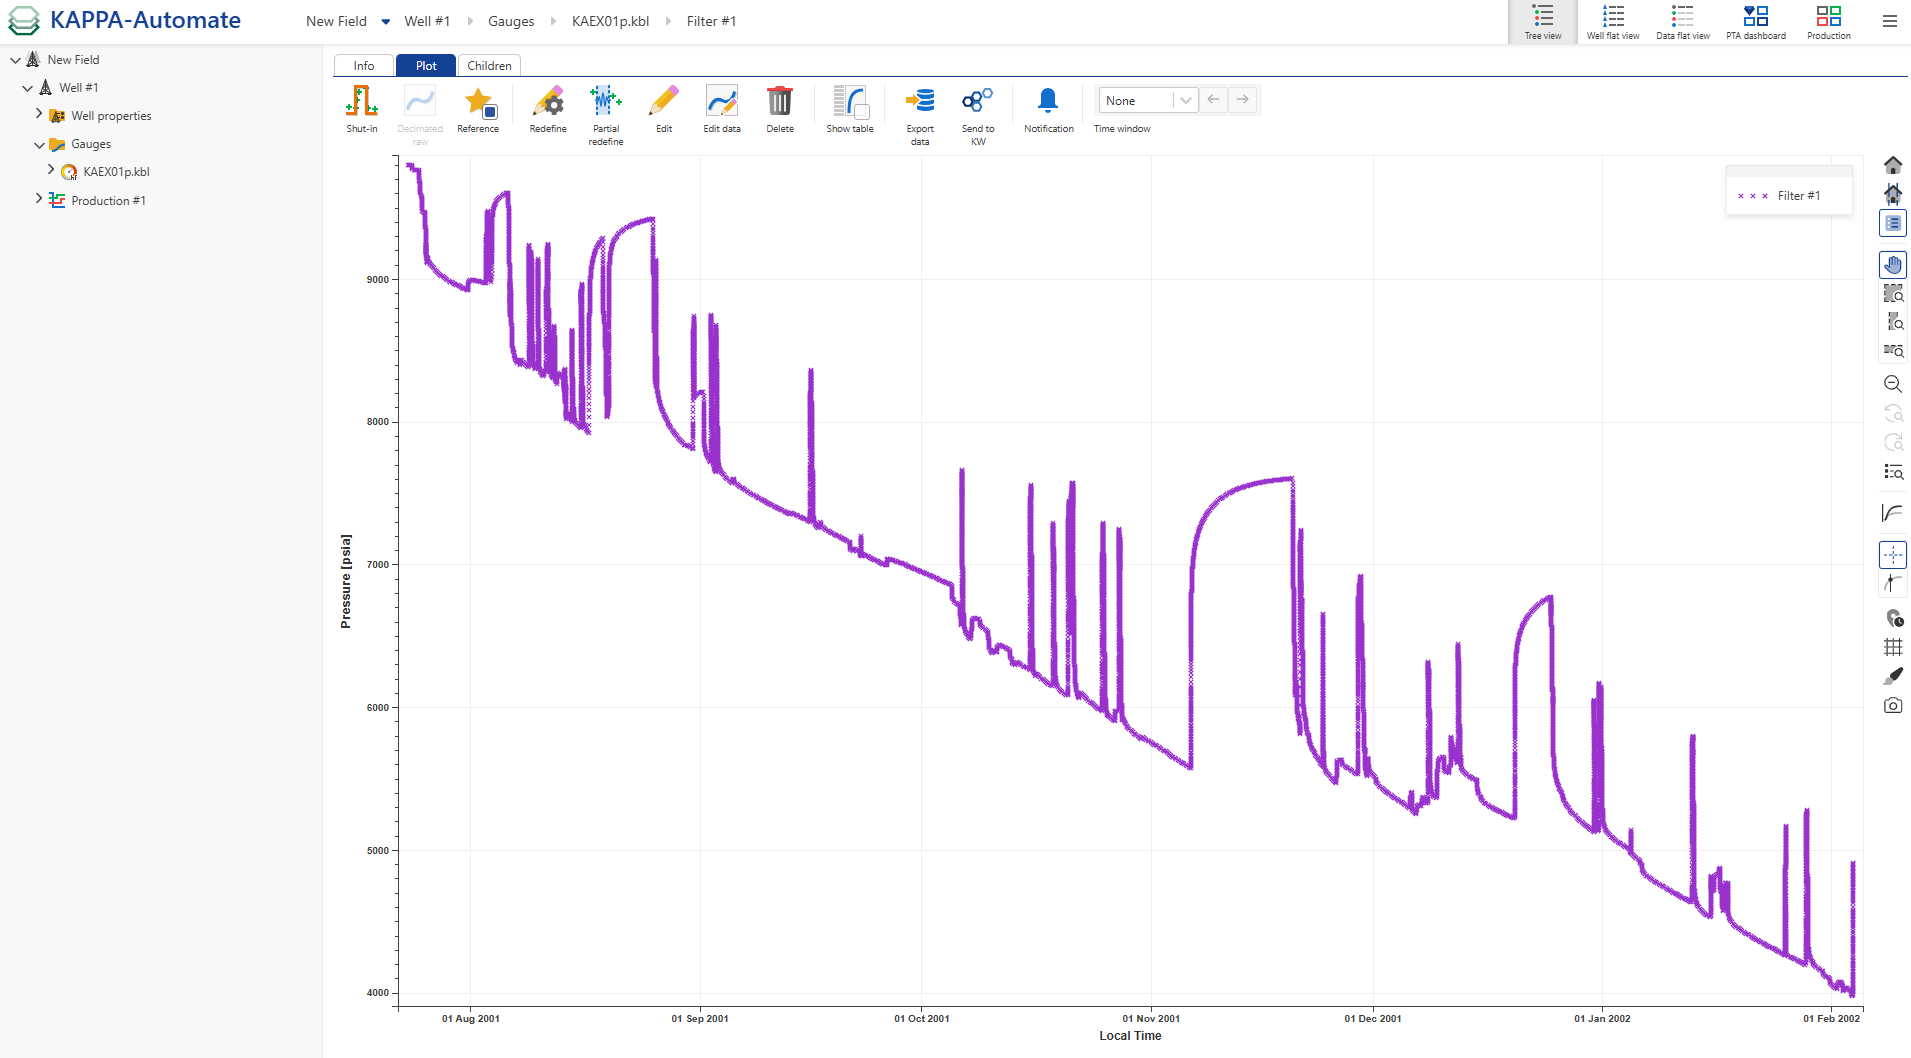
Proceed by clicking on the Load button.
A new gauge is added to the Gauge folder under the Well. Data load is initiated from the data source into the gauge by the K-A background process and interactively displayed in the K-A client browser application as illustrated below:
Important
The Time Window at the top of the plot provides navigation through the data, with these options:
Monthly
Quarterly
Biannually
Annually
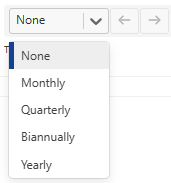
This feature is also available in the Shut‑in channel.