Viewing Loglog Plot inside KAPPA-Automate
Once all the prerequisites are met, user can view the PTA loglog plot for a given well in K-A without having to launch Saphir. In the background, KAPPA-Automate calls the PTA µ-service, which creates a temporary Saphir document, extracts the shut-in and sends the loglog plot data back to K-A to plot.
A Corrected Production must exist for the well.
Select the Shut-in node in the field hierarchy.
Switch to the Plot tab.
Click on View loglog,
 , among the options at the top.
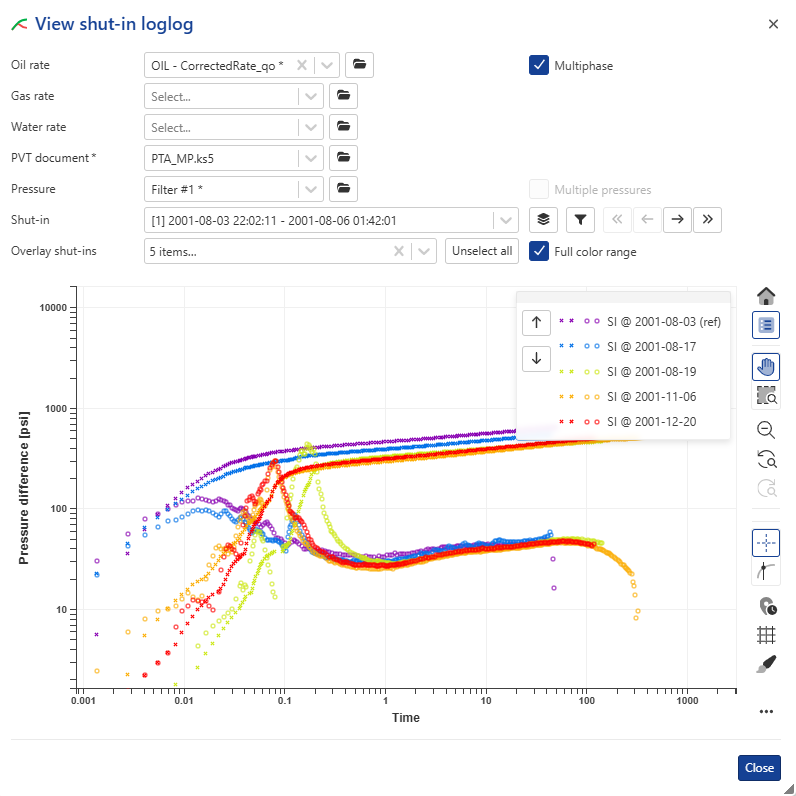
The following dialog will be launched, where the user can select the Rate, Pressure and Shut-in to display.
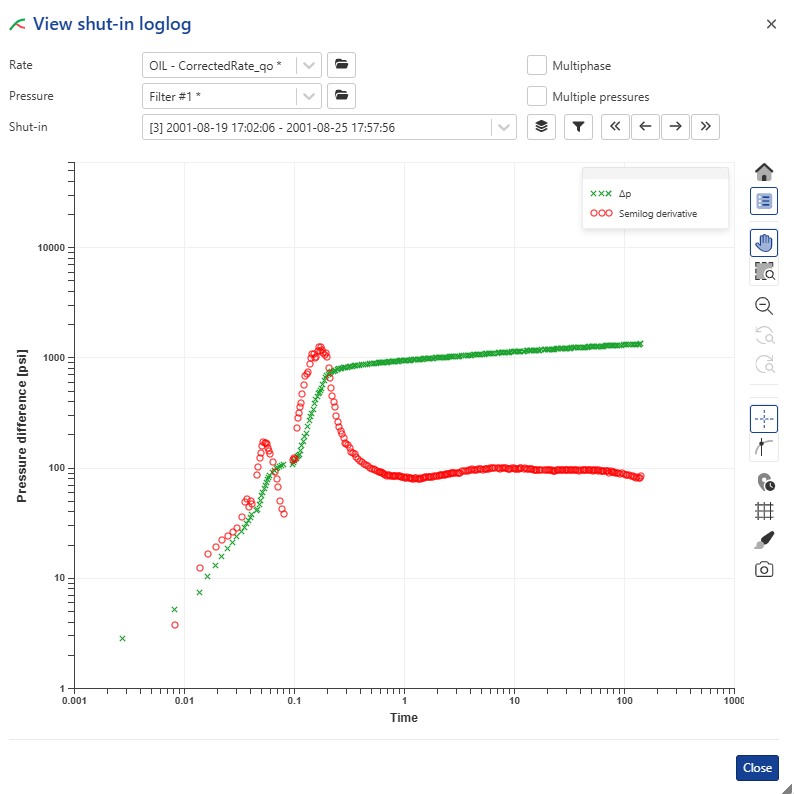 |
Use
 and
and  to toggle between the different shut-ins. Alternatively, use the Shut-in dropdown list.
Use
 to filter shut-ins within a given time window and/or of a given duration.
Use
 to select multiple shut-ins to overlay, and click on
  and
and  to navigate between the different selected shut-ins. The filter should be used to reduce the number of shut-ins to less than 50, as the number of overlay shut-ins is limited to 50.
Multiphase
It is possible to integrate the total rate computation derivative extraction when activating the Multiphase checkbox.
Multiple pressures
The users can visualize the loglog plot using multiple pressure extractions by ticking the Multiple pressures option. This option allows users to evaluate the influence of filter settings on derivative calculations, allowing for a direct comparison with other filter configurations.
 |