Productivity Index (KS)
Objectives
The objective of the user task is to calculate Phase Productivity Index (PI) values at shut-in start times.
Equation
The Productivity Index is calculated using the following equation:
Input
Offset – time from the start of shut-in at which shut-in pressure is taken to calculate pressure drop.
Input gauge – pressure gauge.
Rate gauge – phase rate gauge.
SIID gauge – shut-in gauge.
Output
PI Results – Phase Productivity Index at shut-in start time; if offset value is larger than a shut-in duration the Productivity index is not calculated.
Auxiliary channels:
ResPressure Results – shut-in pressure at the offset time; if offset value is larger than a shut-in duration the value is absent.
RateCumesAtOffset – phase cumulative; values are recorded at shut-in start times.
LastFlowingPressure– last flowing pressure (pressure at the shut-in start time); values are recorded at shut-in start times.
LastRate – phase rate before shut-in; values are recorded at shut-in start times.
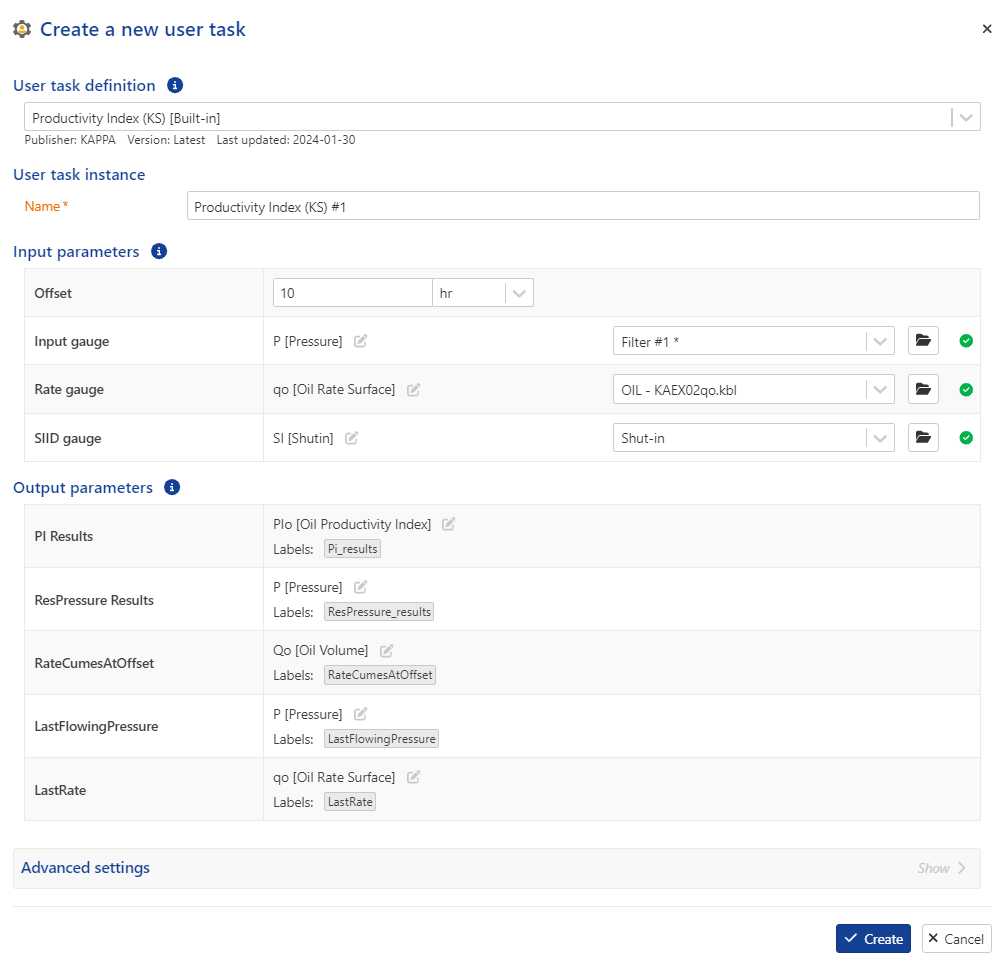 |
User task dialog
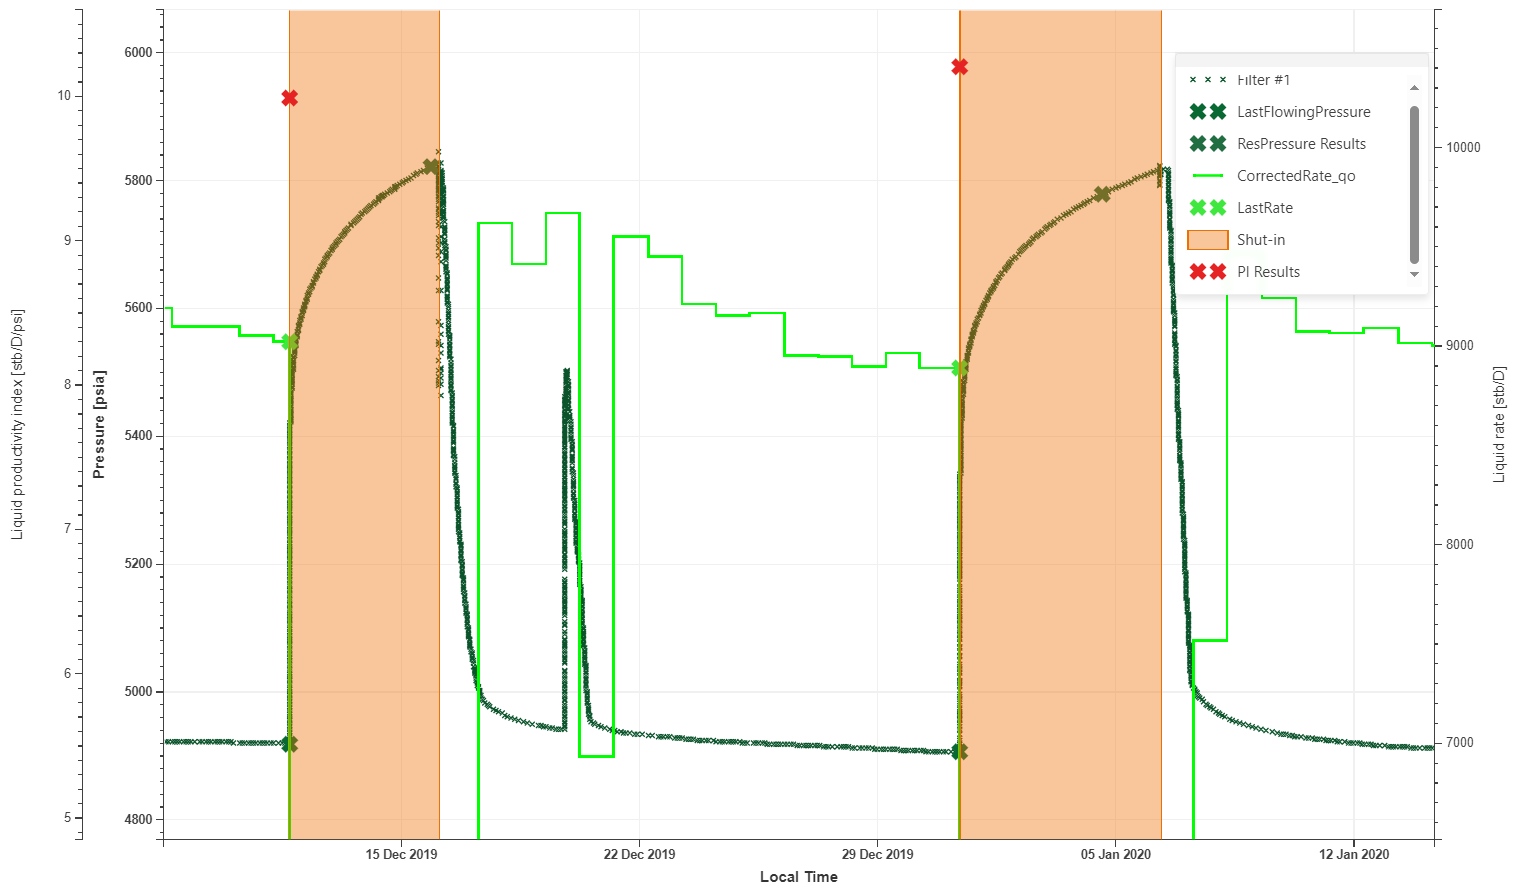 |
Input and output channels
Productivity Index (KS) user task definition
Procedure
At the well level, click on User Task ,
 , from the top options.
In the user tasks list, select Productivity Index (KS).
Assign another name to the user task, if required.
Define the offset (which is the time from the start of shut-in at which shut-in pressure is taken to calculate pressure drop).
Select the inputs pressure and rate channels.
Select the shut-in channel.
Define the output data types and labels, if required.
Click Create.
Plot the resulting output together with the original pressure data, corrected production and shut-in on the same plot.
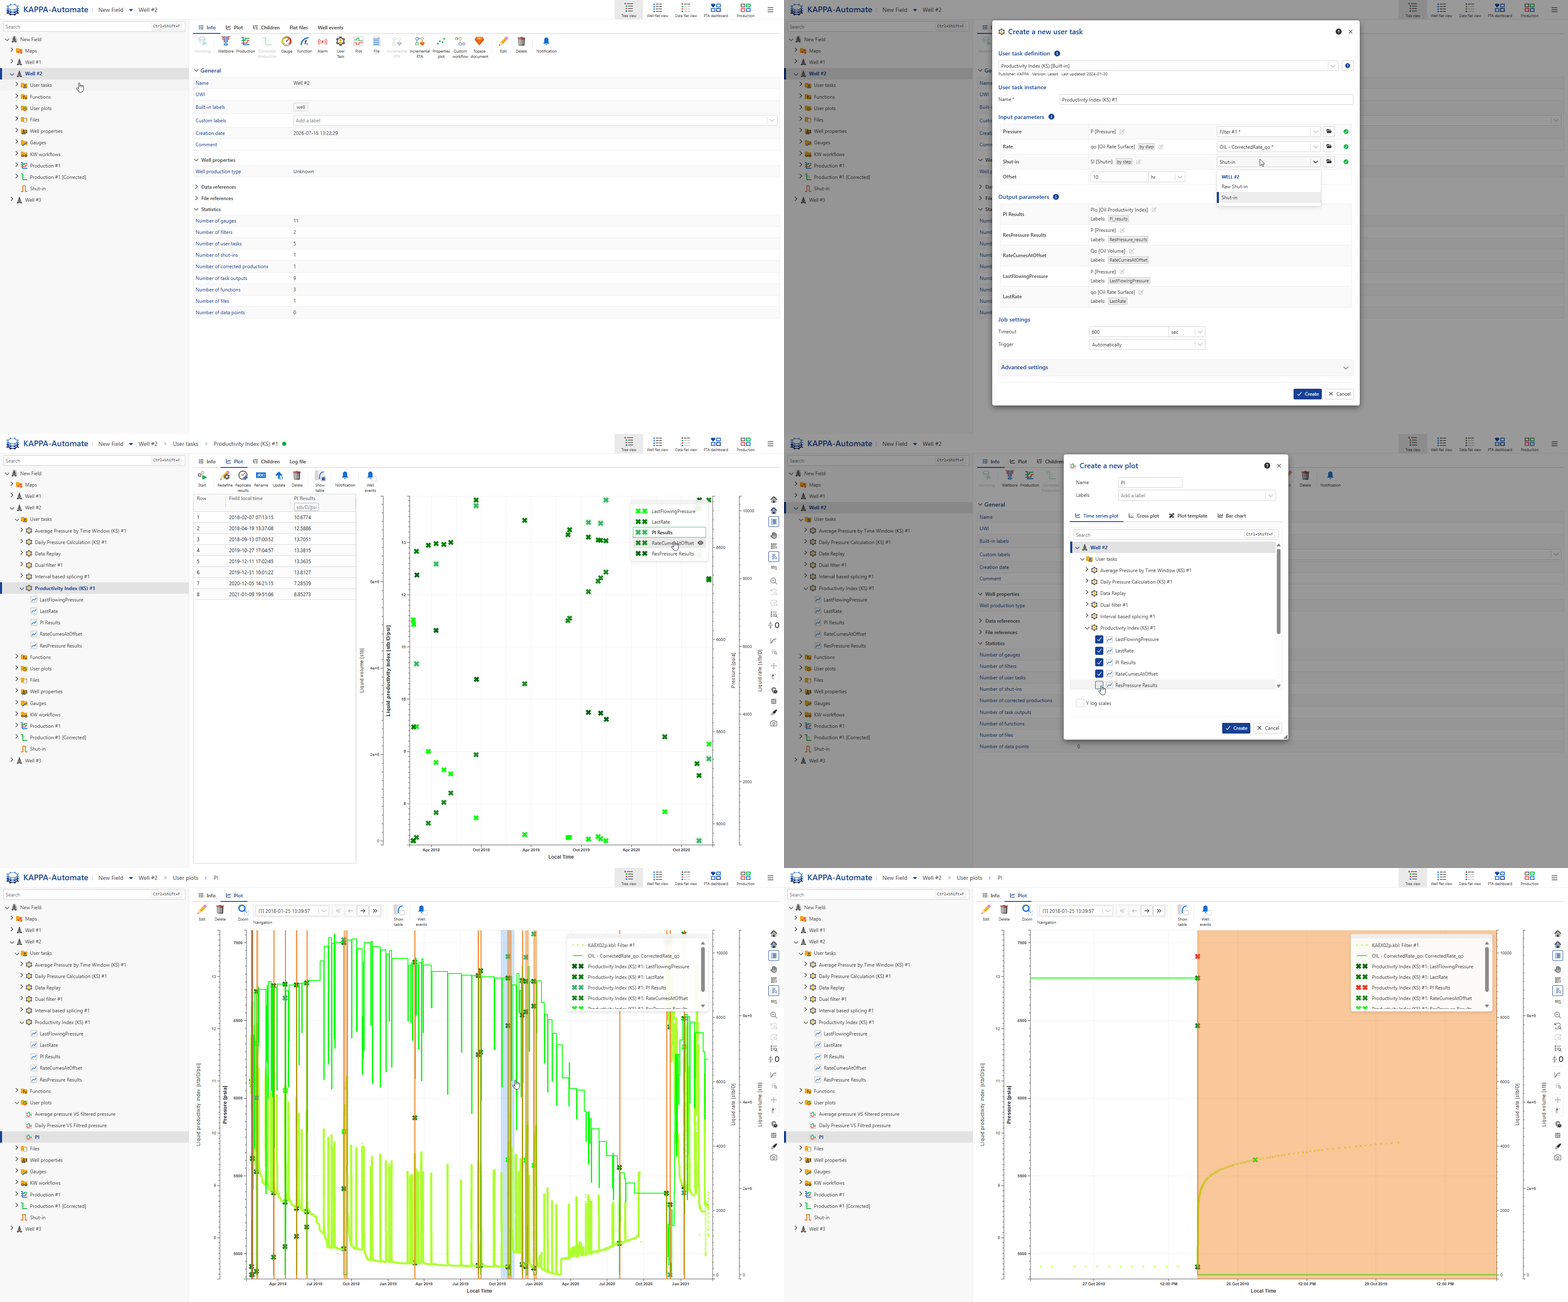
All steps are shown in the .gif below.