PTA Dashboard
The PTA Dashboard provides comprehensive insight into the performance of a selected well over time, enabling users to monitor shut-in events, pressure, production, and analysis results.
A gauge and production phases must be loaded under one or more wells.
Shut-in events and corrected production must be available.
Optional. iPTA workflow and/or any user task results are defined in dashboard template.
Select the Field in the hierarchy.
Click on the PTA Dashboard,
 , option in the top right toolstrip.
Define the well of interest (multi-well selection can be selected which allows pressure/rate display for others).
Choose the dashboard template to apply.

From the toolstrip, you can :
Enable the Overlay option to display all Log-log shut-ins in a single plot.
Hide empty plot to clean up the view.
Show well events.
Use the Previous,
 , and Next,
  , options at the top to navigate through the different shut-ins. The zoom will reset to each shut-in.
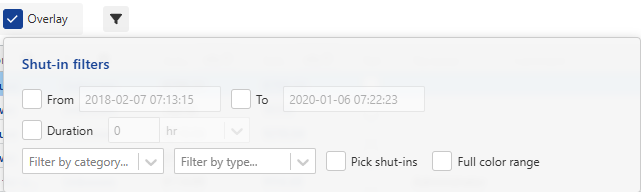
Click on the Filter,
 . Once selected, shut-ins can be filtered by:
Date range (can be edited graphically or manually).
Duration.
Category.
Type.
Individual Shut-in.
Note
Shut-ins that are not selected are excluded from the log-log plot and greyed out in other plots.
If more than 50 shut-ins are available, only the 50 longest are shown in overlay by default.
Use Full color range when displaying fewer shut-ins to o better distinguish them.
The number of filtered shut-ins is now displayed in the PTA Dashboard.
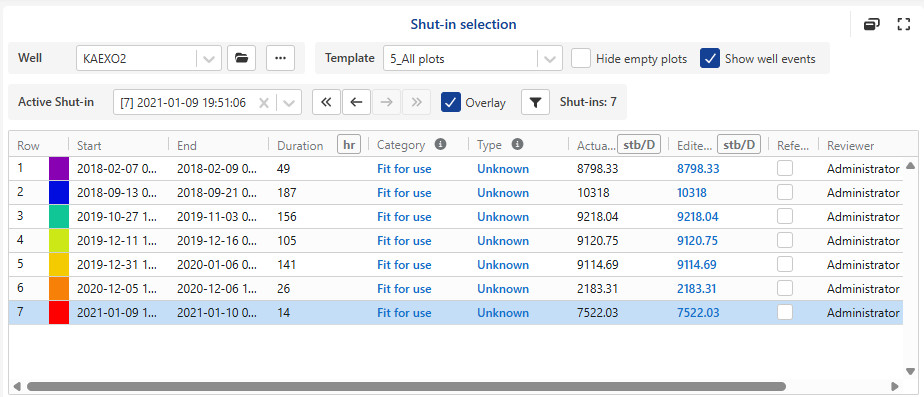
Select the pressure, the rate data and the well properties container.

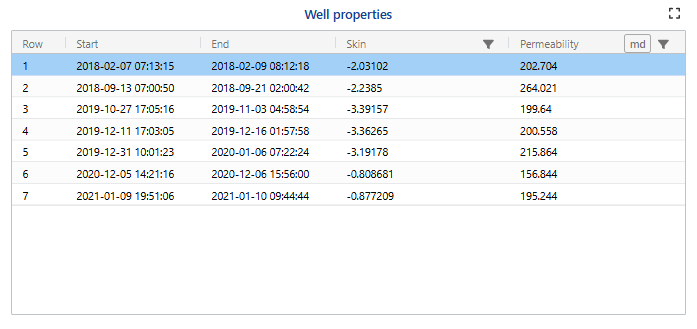
View the Well Properties table (e.g., Skin and Permeability), which is automatically displayed when available. It will appear if the PTA dashboard template includes iPTA results.
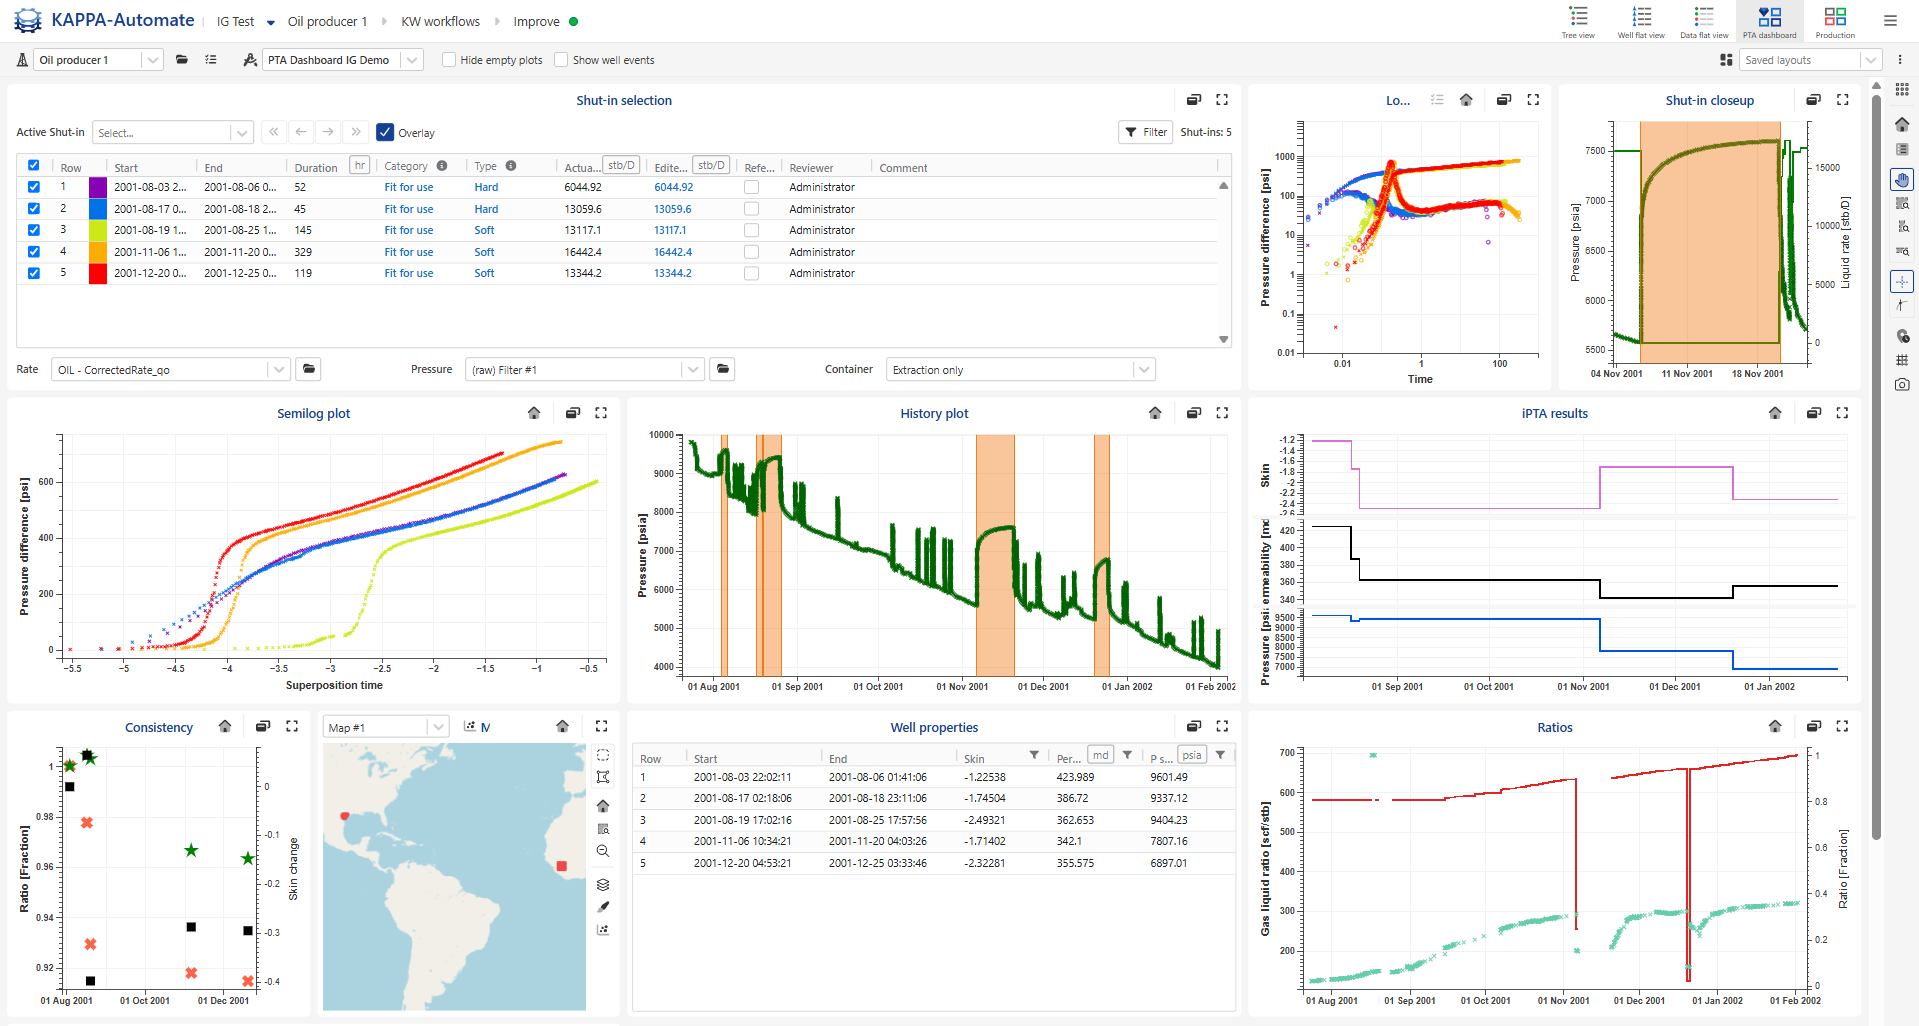
See one global toolbar in the right hand side toolbar.
All elements in the dashboard can be moved and resized.
Select the active shut-in from any plots.
Only maps that have already been created in the tree view under the selected field are available in the map list. It is not possible to create new maps from the PTA Dashboard view.
To expand/ restore plots, use the Maximize ,
 and Minimize ,
 options.
To detach a plot into a separate window, click on
 .
.
 |
Note
Multiple attributes of shut-ins are included here in the table which is , such as :
Category: fit for use, not fit for use or unknown
Type: hard, soft or unknown
Reviewer: Who flagged the shut-in.
Reference shut-in: it is useful in several process for instance consistency check
Comment
Actual rate:
Edited rate: it is possible to adjust the last rate step value before shut-in if inconsistencies are observed and unexplained (no physical meaning) in the BUs. By editing this value, the log-log plot will shift vertically, the corrected production will be recomputed upon submitting the edited rates, and rates plot will be refreshed accordingly. The option is available when corrected rate is based on the selected shut-in, otherwise is is disabled.

Important
Toggle between Default and Compact layouts by clicking on
 .
.Shut-in info tooltips are added to the Category and Type attributes.
It is possible to select multiple shut-in checkboxes when clicking on the shift key on the keyboard.
Shut-in attributes can be added to the log-log plot legend by clicking on ,
 , and choosing the desired attributes.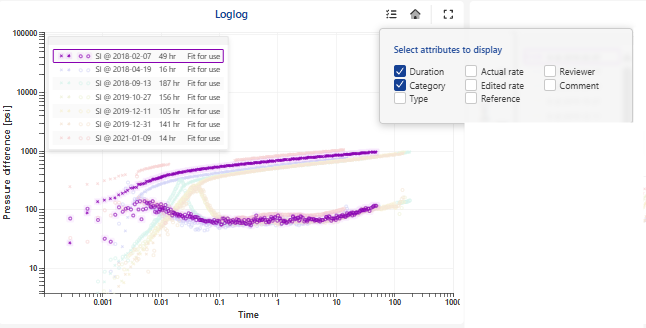
Defining Layout
The Production Dashboard supports saving and managing custom layouts, allowing consistent visualization across sessions or sharing configurations with other users.
Open the layout menu by clicking on
 .
.Select New layout.
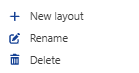
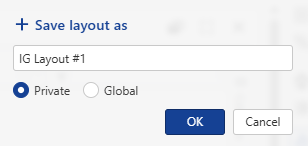
Provide a layout name and choose the storage mode:
Private: saved locally on the machine.
Global: saved in the database and shared with all users.
Once saved, layouts can be renamed using
 or deleted using
  .
.When the dashboard configuration is changed (e.g., plot order modified, plots added or removed), a Modified
 notification appears:
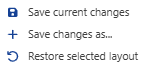
Clicking the notification opens a dialog offering three actions:
Save changes: update the existing layout.
Save as new layout: create a new layout while preserving the original.
Restore layout: discard modifications and revert to the saved layout.
To load an existing layout:
Click on

Select the desired layout from the list.
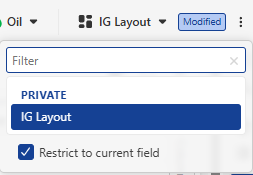
Layouts can also be restricted to the current field, ensuring that the selected layout is automatically applied whenever the field is accessed.
Multi-well selection
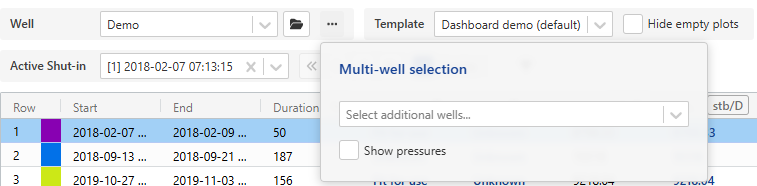
This feature helps identify potential interference between wells within the same compartment by displaying production and pressure data on the same plot. It offers a more comprehensive and clearer view of field behavior.
To select multi-well:
Click on
 .
.Select the additional well(s) from the list.
Optionally, check the Show pressure checkbox to include pressure data.
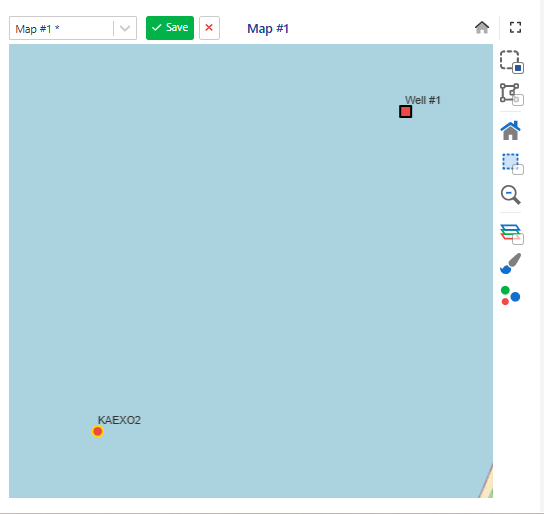
Wells can also be selected directly from the map:
In the map options, choose either:
Rectangular selection ,
 .
.Polygon selection ,
 .
.
Draw a rectangle or polygon on the map to include the wells to be displayed on the history plot.
Note
If the map view aspect is modified, the changes will be saved and persisted when the Save option is selected.