Custom Plots
Custom plots are created by leveraging a special API with the help of User tasks or externally. Formatting of such plots is not limited by the platform functionality and can have any representation of the data. Custom plots can be located in the field hierarchy either under the folder Plots or under the User tasks that creates the plot; the location is defined by the user in the script.
For further information about the way the user can develop user tasks for KAPPA-Automate using Python, see the KAPPA-Automate Extension Guide.
The figures below show three examples of custom plots, created by a user task.
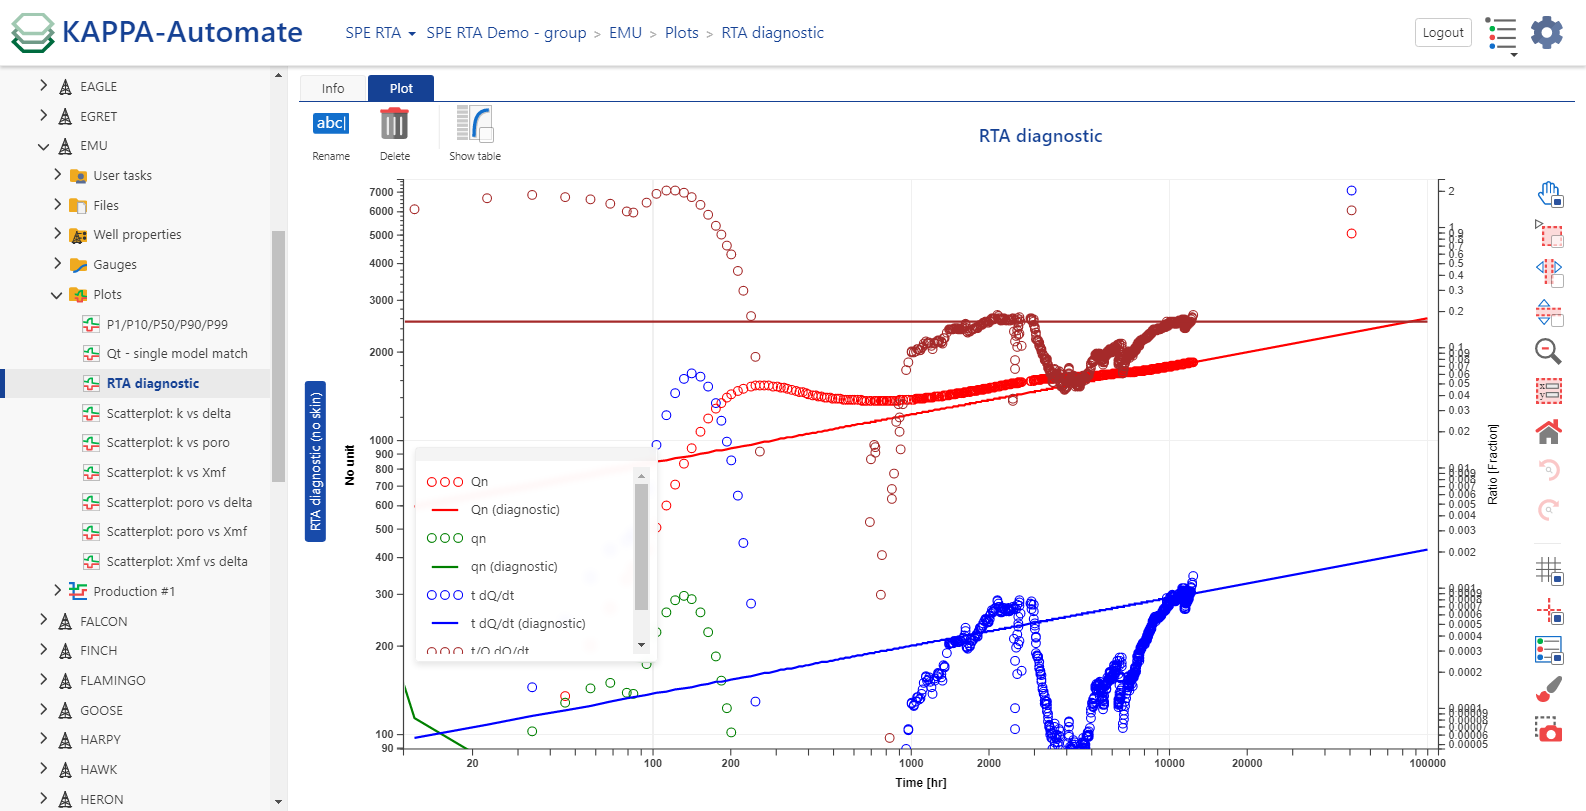 |
sRTA diagnostic plot
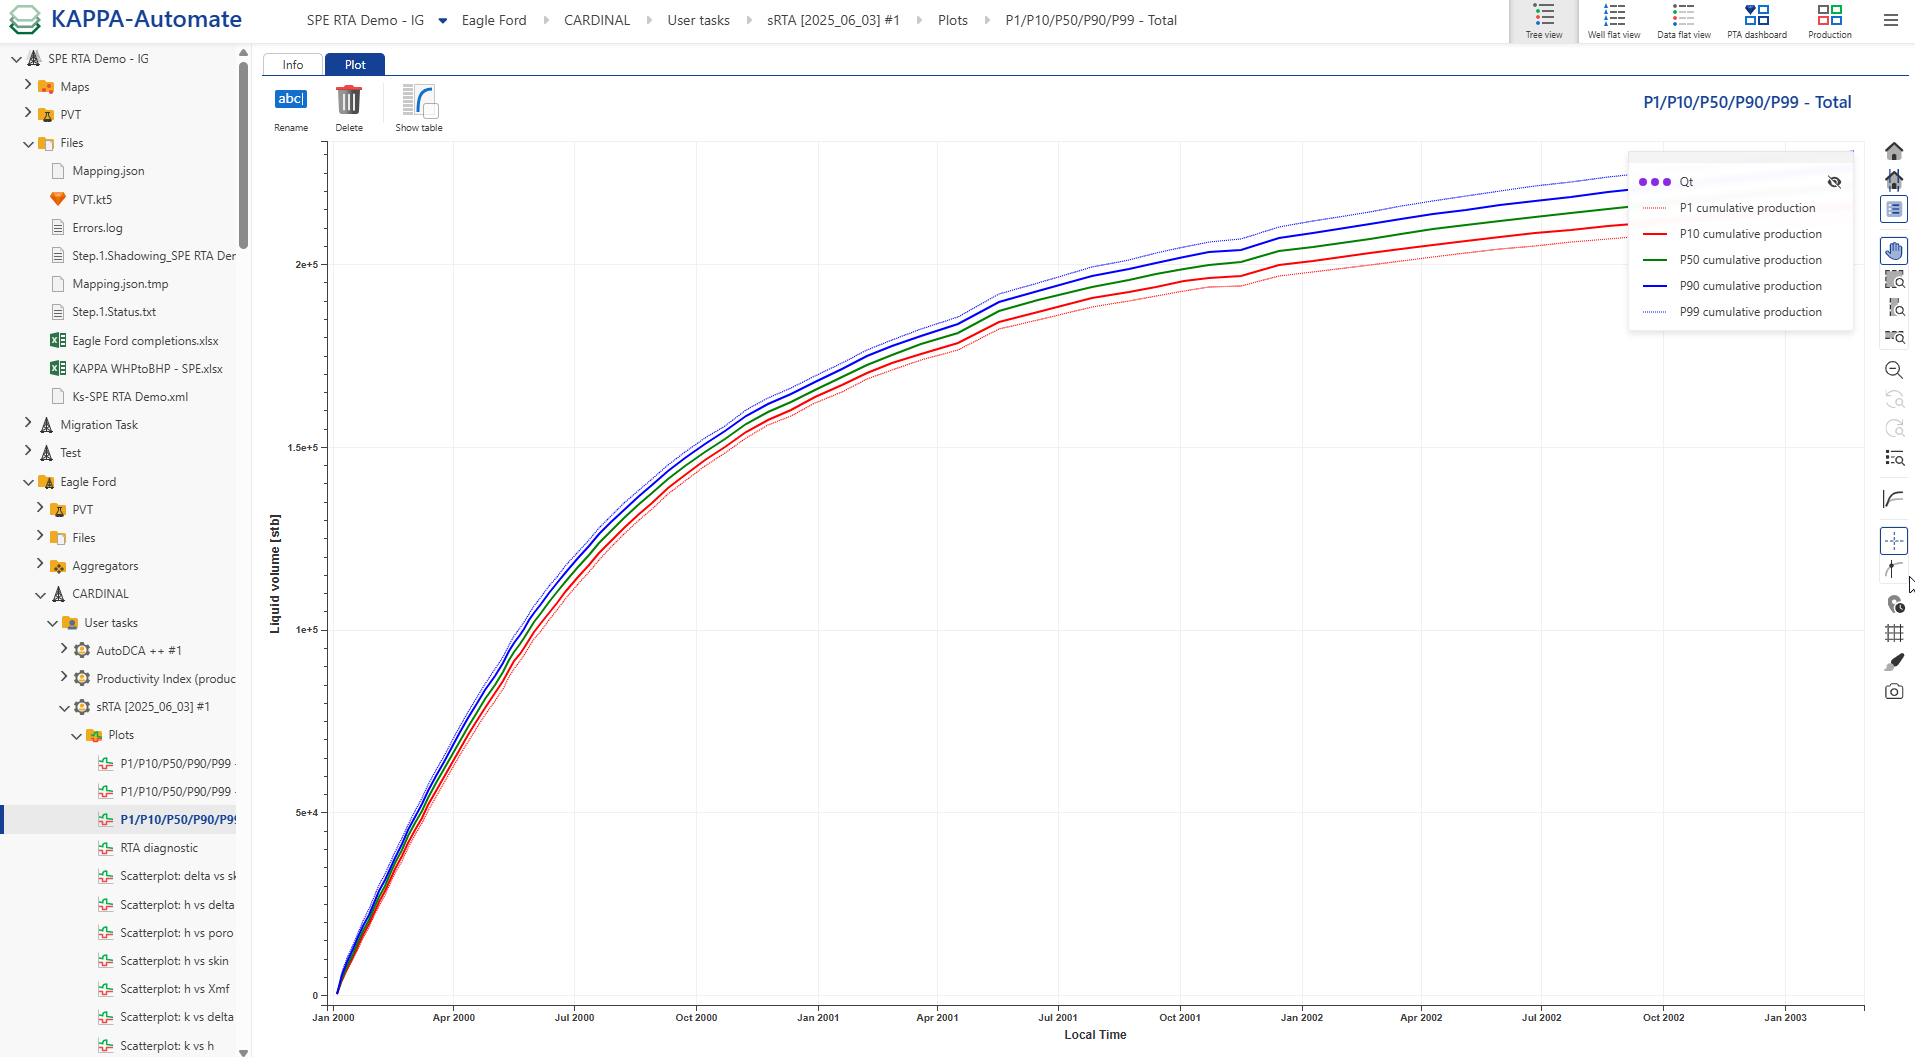 |
sRTA probabilistic forecast plot
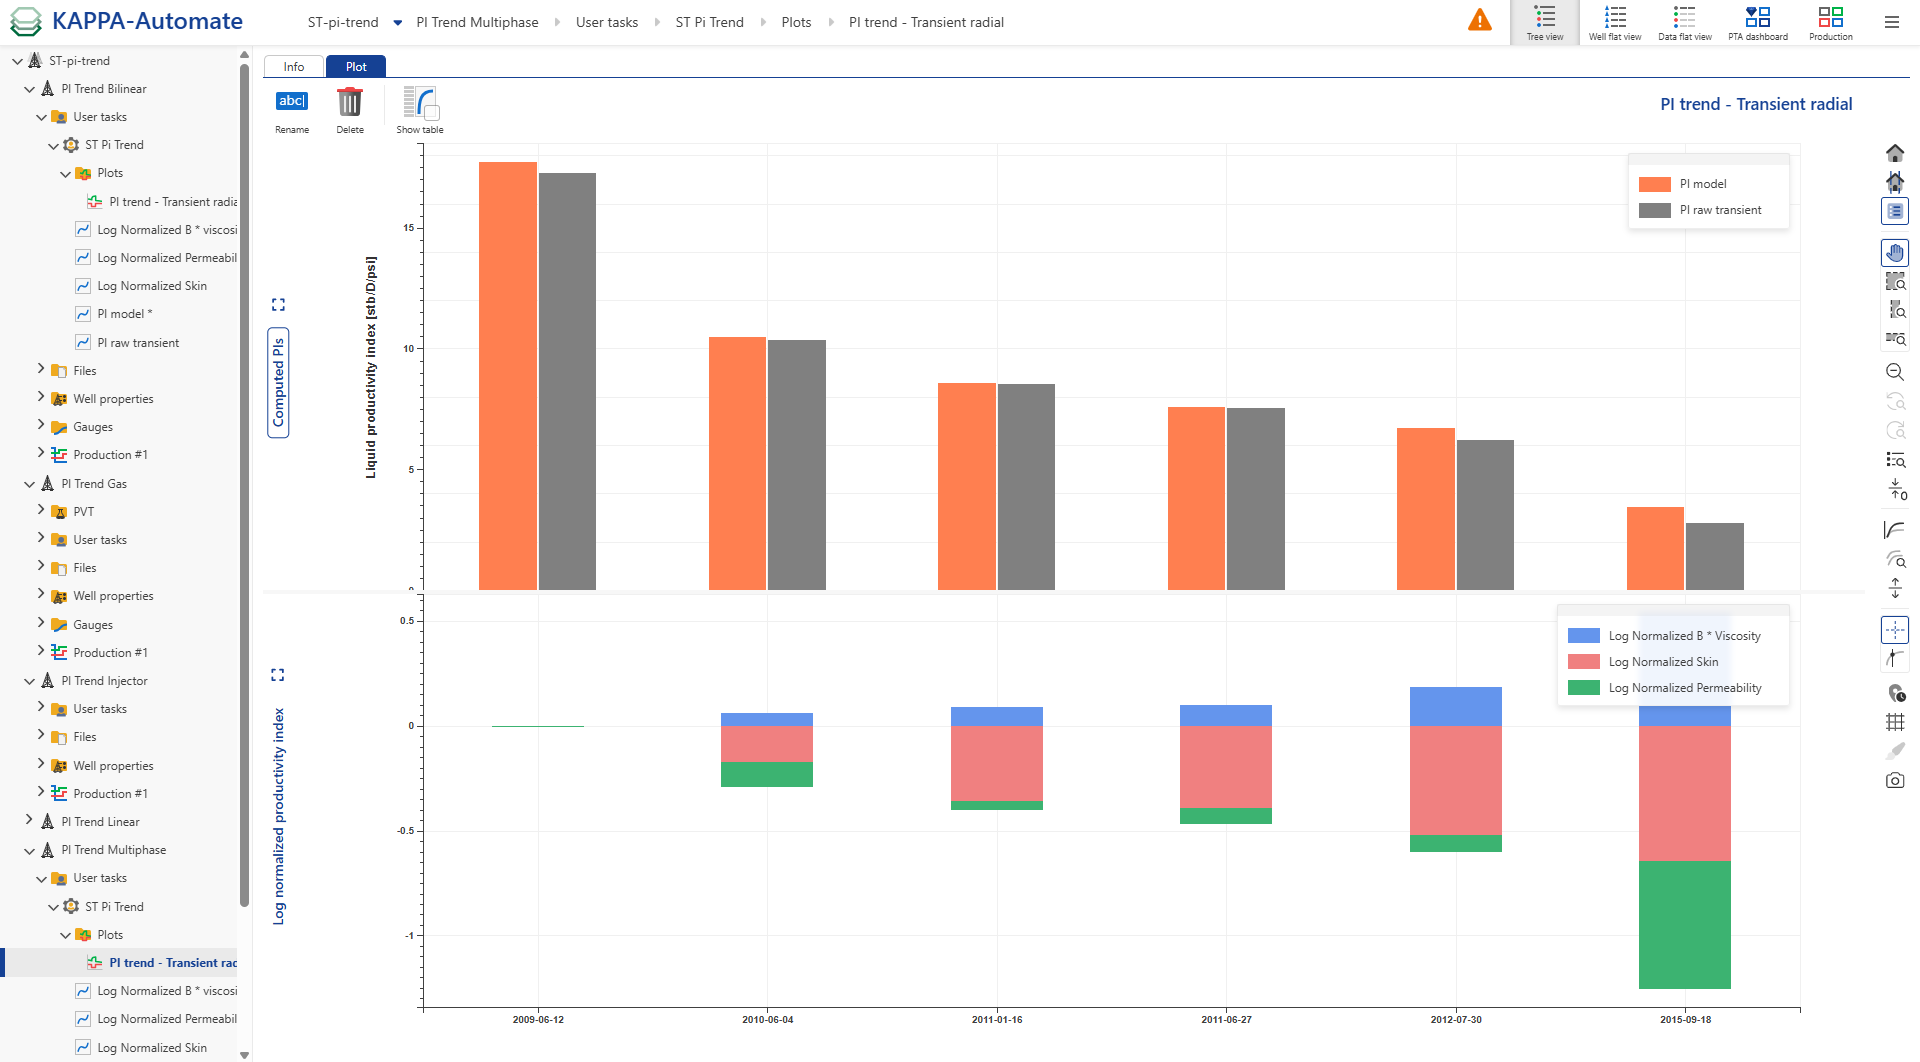 |
PI trend plot
In addition to individual custom plots, all plots generated by user tasks can be displayed together in a single dashboard. This dashboard aggregates every user task plot onto one page as shown below:
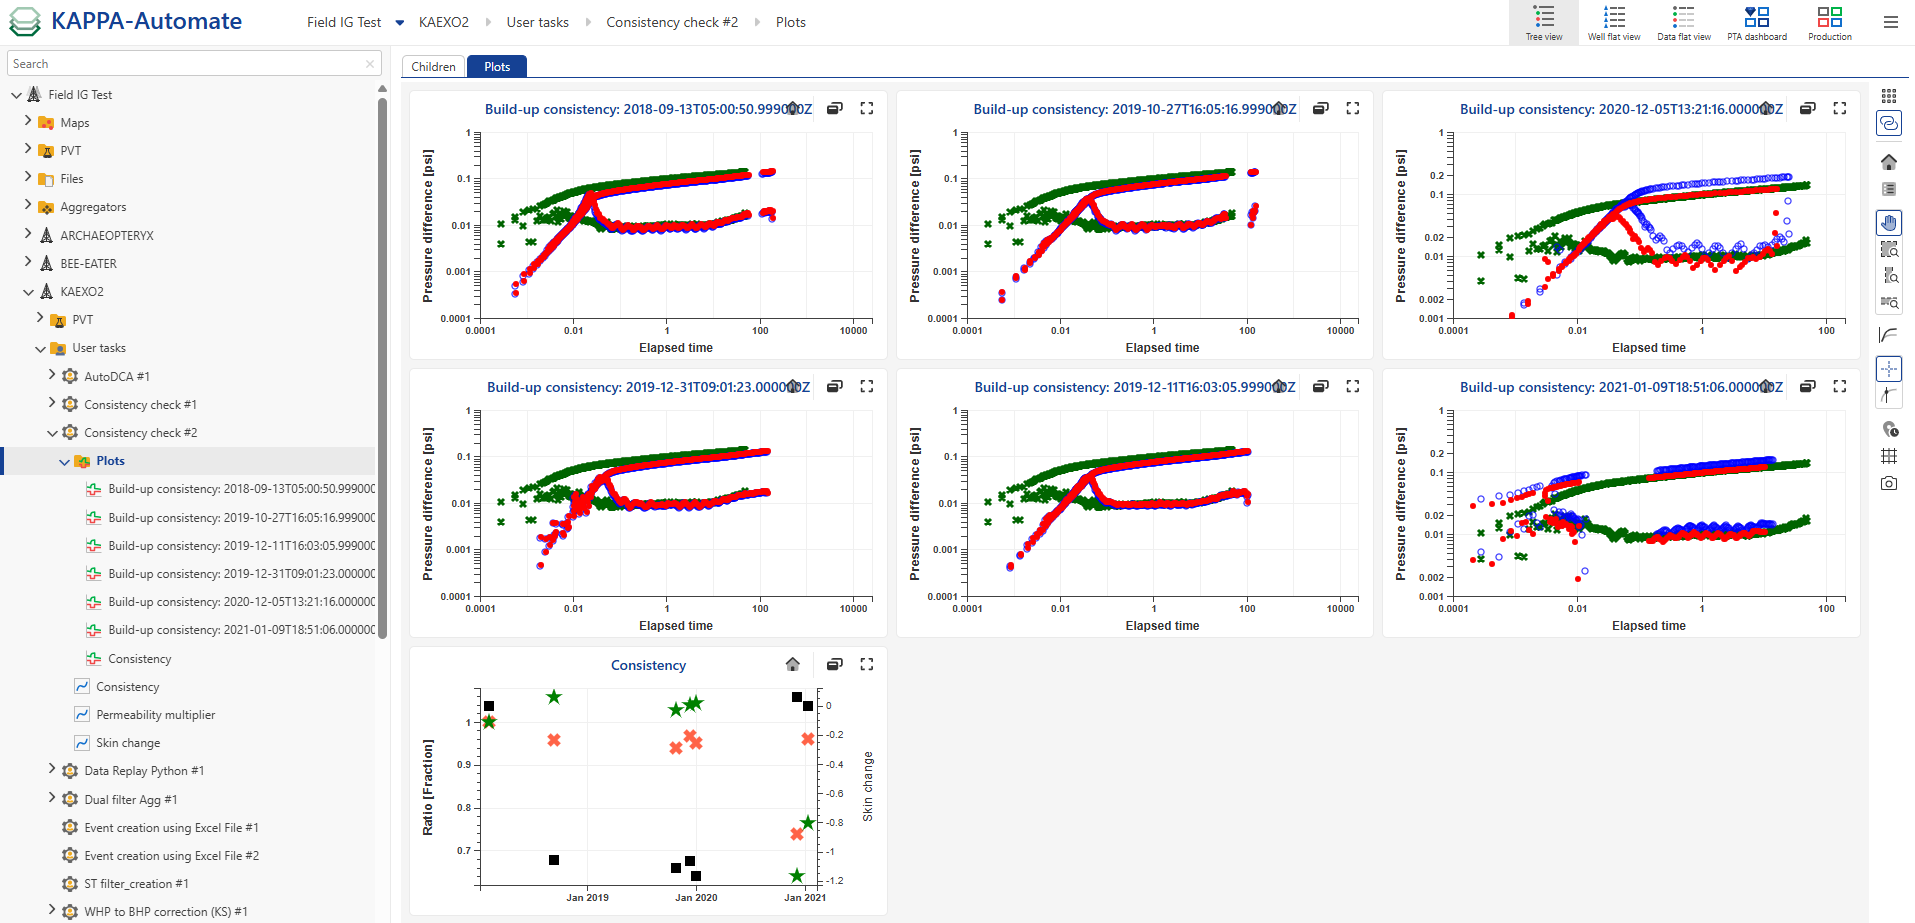 |