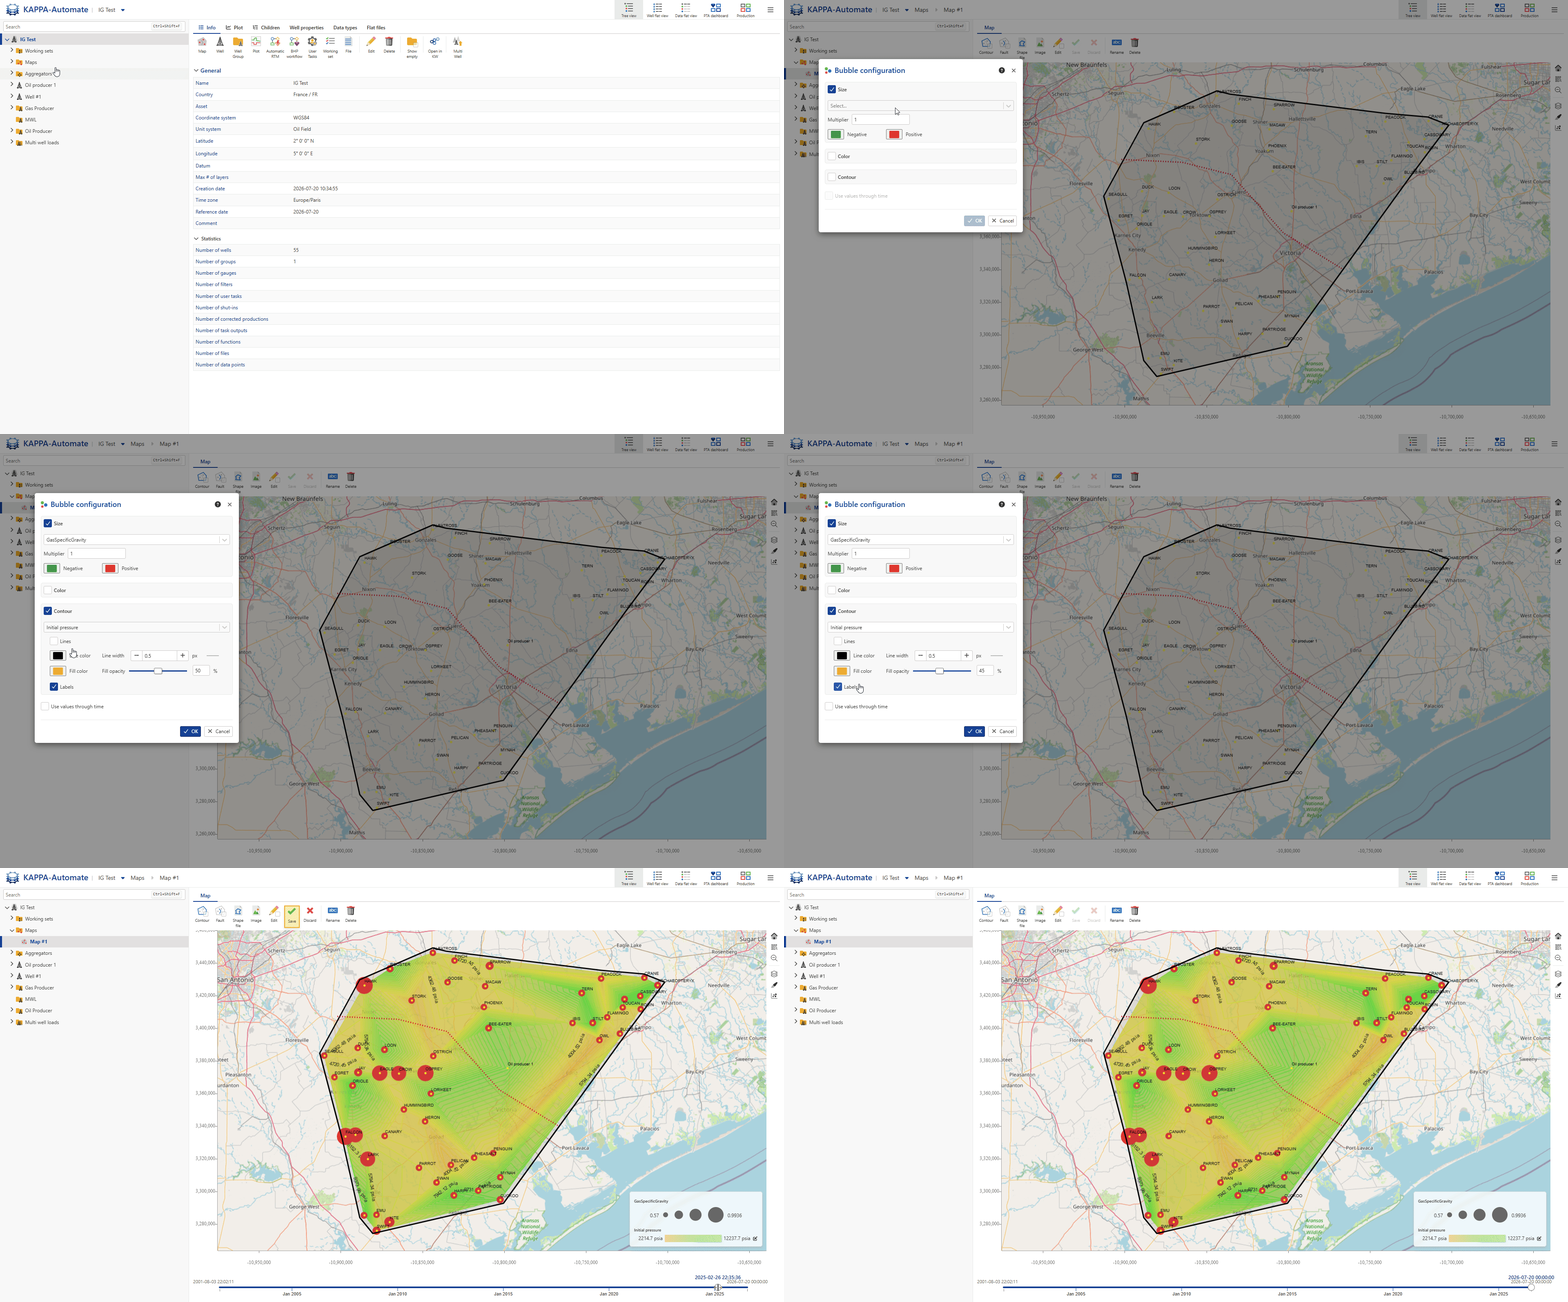
Bubble Maps
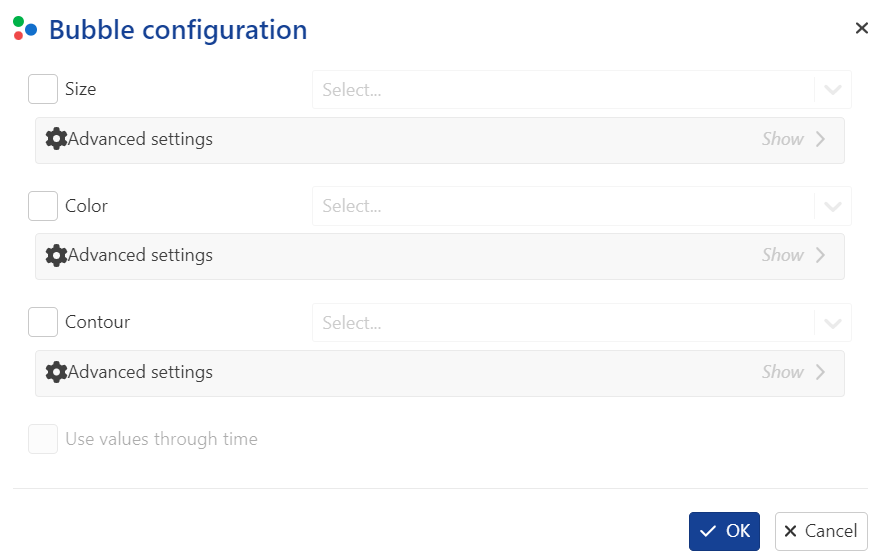
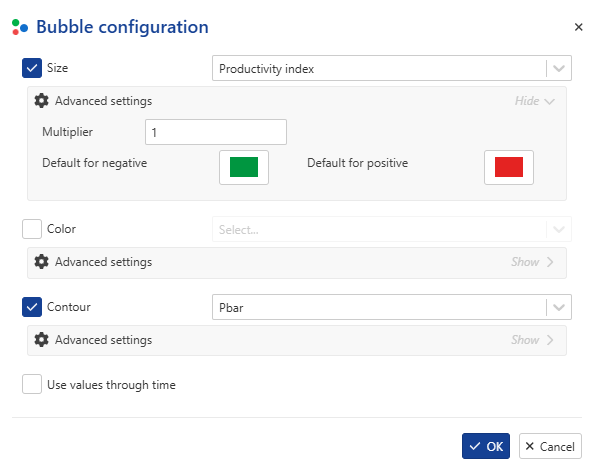
Well properties or analysis results may be viewed in form of a bubble map. Three different map properties - bubble size, bubble color & contours, may be assigned three different parameters for display. To access the bubble map configuration, click on  in the tool bar on the right.
 |
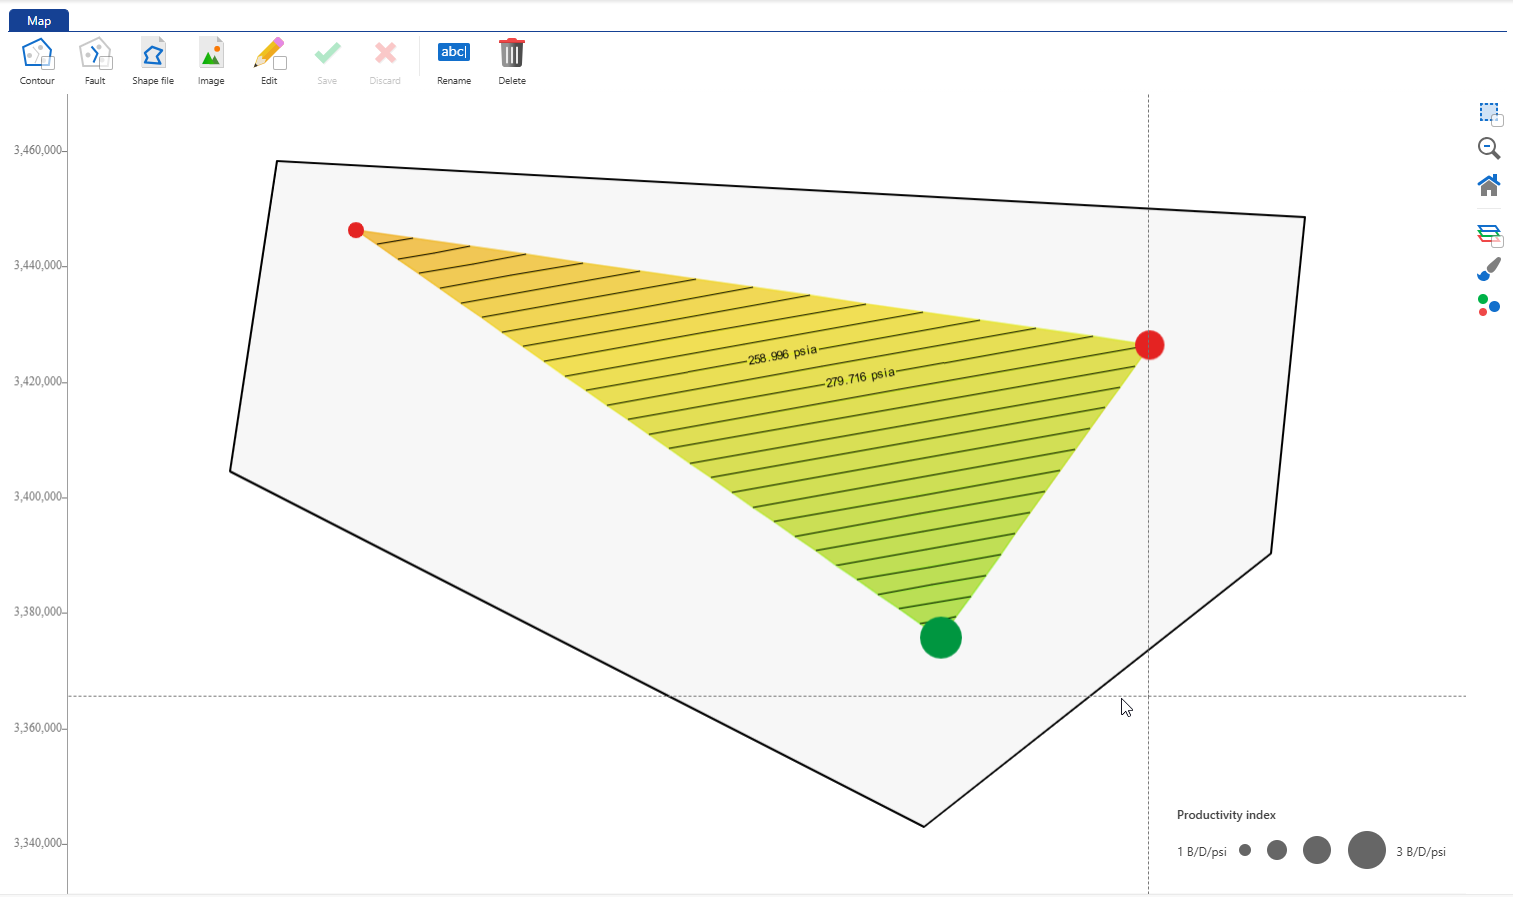
Bubble map displays for rate and rate-related well properties now use absolute values for bubble sizes, with red indicating positive and green indicating negative values.
 |
 |
See the .gif below