Creating iRTA Workflow
The iRTA workflow starts with a Topaze document containing a user-generated analysis. The workflow can then proceed automatically from a pressure and possible rate feeds. See Incremental RTA (iRTA) for more details.
A Topaze document must be uploaded under the well. This will serve as the seed document for iRTA
Select a Topaze document in the field hierarchy and click on Incremental RTA,
 , under the Info or Plot tab: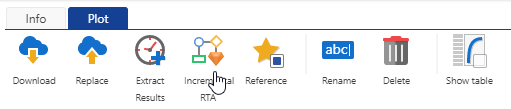
This will launch the following iRTA dialog:
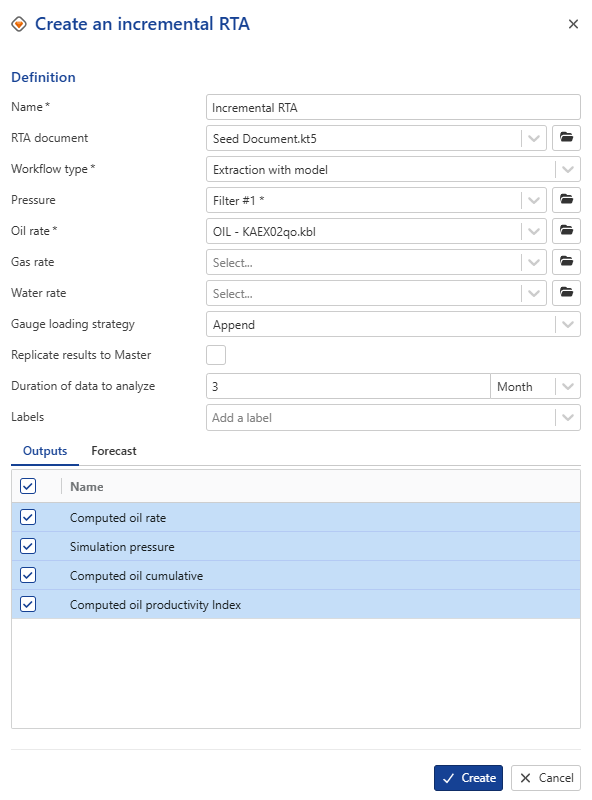
Give the iRTA workflow some Name.
Select the seed RTA document to use for this iRTA (by default, it will be set to the document in step 1).
Select the Pressure and Production channels to use for this iRTA. The Production type (oil or gas rate) will depend on the reference phase in the seed Topaze document.
Set the Gauge loading strategy, Workflow type and define Duration of data to analyze (see Incremental RTA for more details).
Optional. Add a label(s) if necessary.
Note
This label(s) will tag the iRTA instance, the generated documents, the associated well property container and the well properties in the container.
Select the gauges to output.
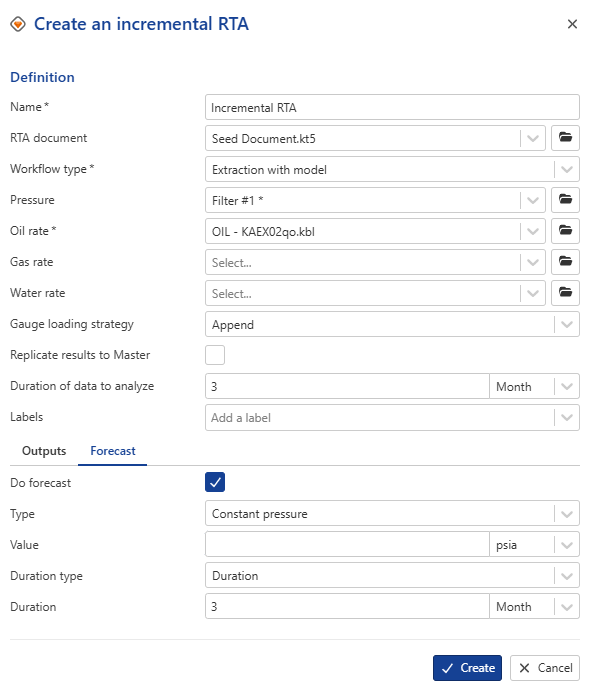
Switch to Forecast tab:
Check Do forecast to enable forecasting.
Select the forecast type. Two options are available:
Constant pressure
A constant pressure value must be defined.
Three duration options are available:
Duration: total forecast duration
End date: forecast ends at a specified date.
EUR: forecast ends when the abandonment rate is reached (an additional input appears for the abandonment rate)
Pressure Trend
Pressure follows a decline trend.
A slope is automatically computed using a line fit over the last 3 months, requiring at least 10 points.
When this type is selected, the following must be defined:
Minimum and maximum pressure values
Duration option: End date or Duration (Elapsed time)
Click on Create.
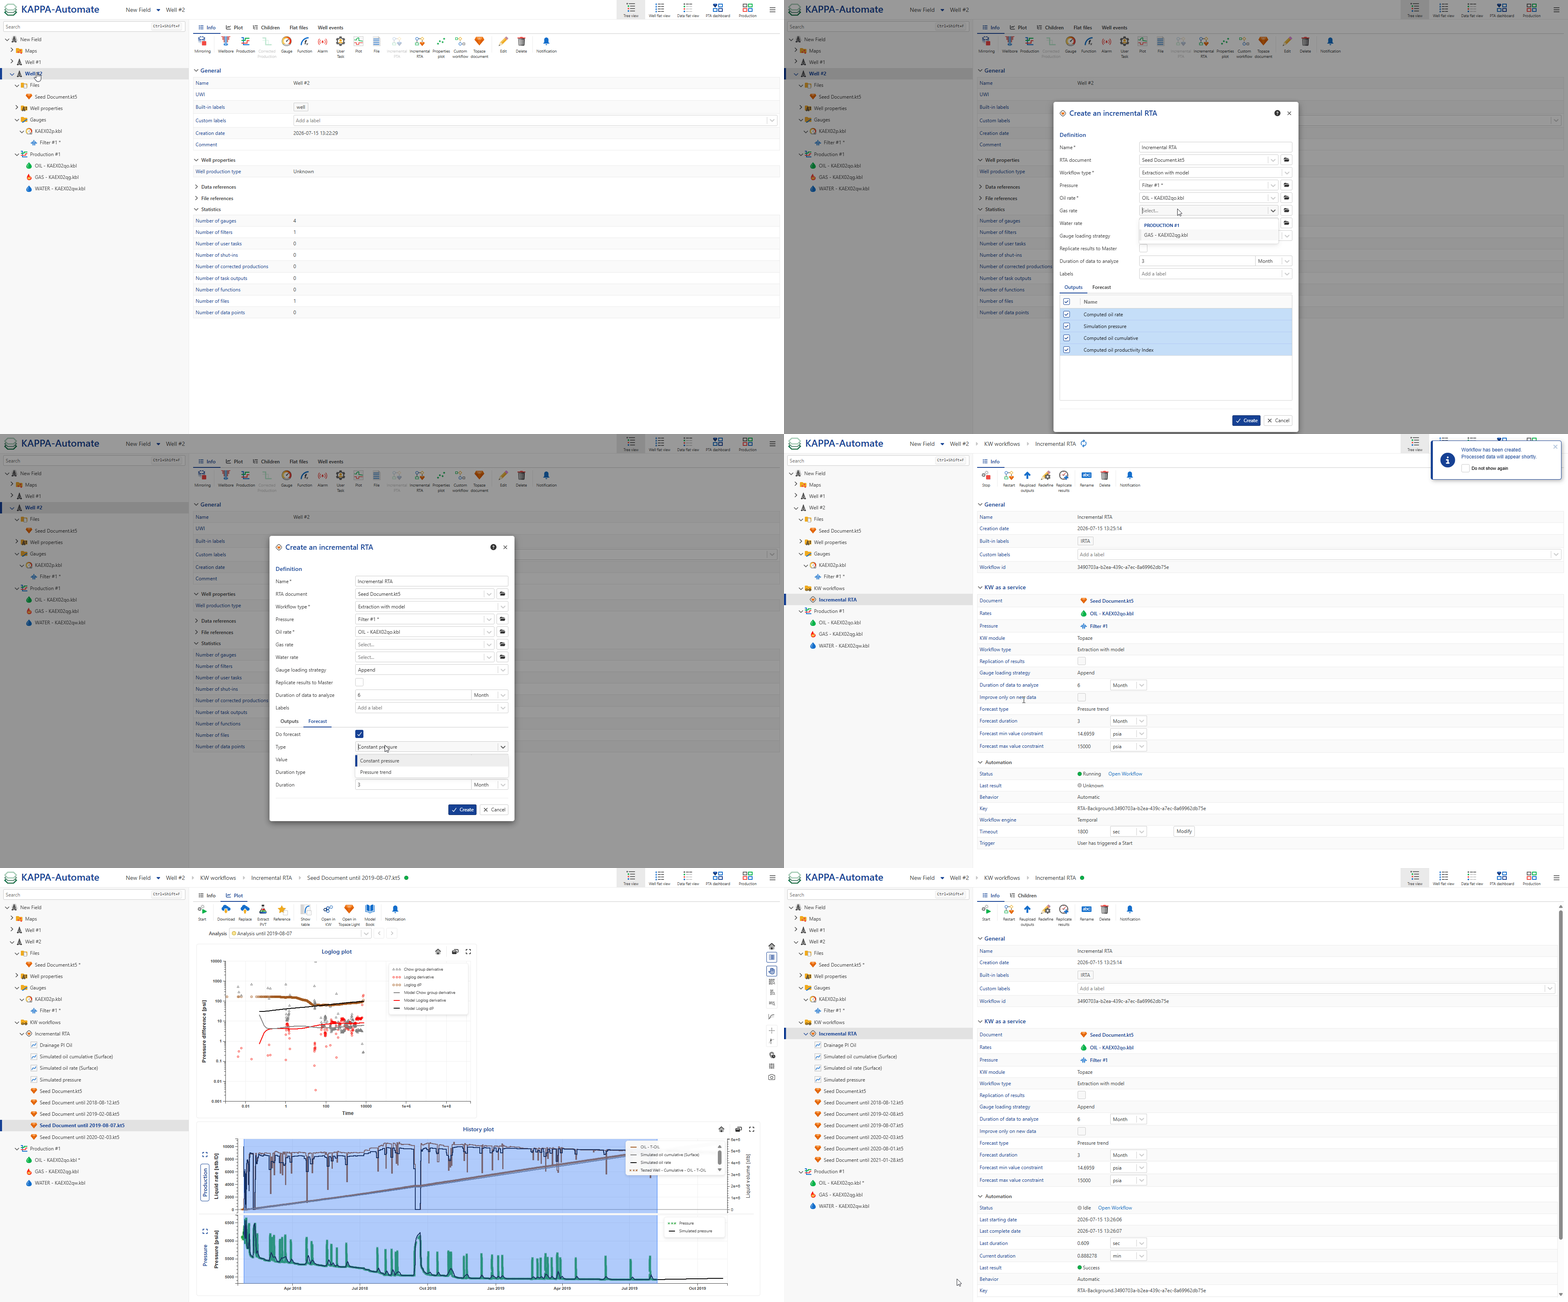
All steps are shown in the .gif below.