Creating Shut-In Identification
Shut-in Identification (SIID) can be performed on pressure (or temperature) history data. Shut-ins are identified by searching for discontinuities in the pressure (or temperature) data. A tangent crossing algorithm fits tangents at some key points around the transient to identify the start and end of the shut-in period. Identified shut-ins are recorded in a special SIID logical channel that has the value of “1” for the duration of the shut-in and “0” everywhere else.
A Pressure or Temperature gauge must exist under the well.
If the gauge is high-frequency, it must be filtered.
Select the Pressure or Temperature gauge in the field hierarchy.
Note
SIID works on low-frequency or filtered high-frequency gauge data only. It cannot be used on high-frequency gauge data directly.
Click on Shut-in,
, at the top under the Plot or Info tab.
Define whether the algorithm should look for Build-ups or Fall-offs.
Set the Minimum pressure change and Minimum shut-in duration for the identification criteria.
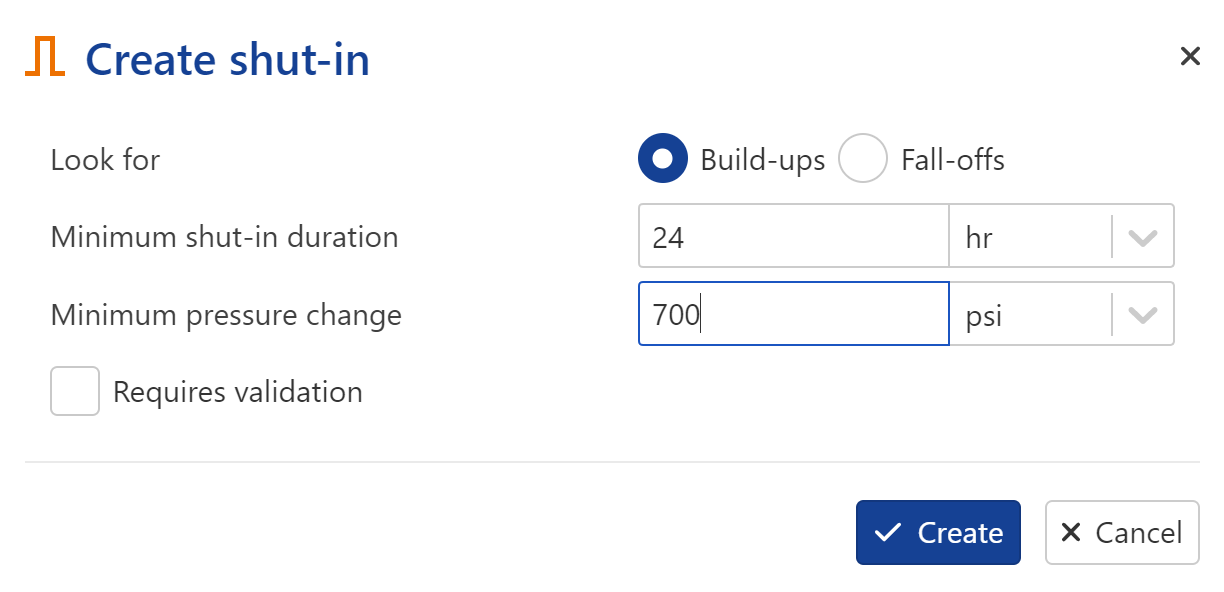
Select whether any detected shut-in requires user validation before being used or not.
Click on Create.
Houzé, O. , Allain, O., and Josso, B.: "New Methods Enhance the Processing of Permanent Gauge Data.", SPE 139216-MS
The topic below describes the different options to navigate through the shut-ins, once identified. These options apply whether or not Requires Validation was enabled when Creating Shut-In ID.
These options can be accessed by selecting the Shut-in node in the field hierarchy, and switching to the Plot tab.
Zooming in on a selected shut-in
Click on a shut-in on the plot to select it.
The shut-in will be highlighted in blue.
Click on Zoom,
, among the options at the top.
The zoom window will reset to the selected shut-in. The icon will change to
, denoting that the zoom mode is on.
Zooming in on a different shut-in
With the zoom mode on, zoom out,
, or reset zoom,
, using the plot options on the right. (see Plot Scaling and Display Options for more details).
Click on the new shut-in.
The zoom will reset to the time range of the shut-in just click on.
Navigating through shut-ins when zoomed in
Use the Date selection drop-down list,
, or the Previous,
, and Next,
, options at the top to navigate through the different shut-ins. The zoom will reset to each shut-in.
Related Topics
Due to changing nature of data with time, it may be necessary to change the shut-in identification criteria with time. This may be achieved using the Shut-in Redefine option.
Prerequisites
A shut-in must exist to access this option.
Procedure
Select the Shut-in node in the field hierarchy.
Click on Redefine,
, at the top under the Plot or Info tab.
Redefine the shut-in criteria as needed.
Set the date and time from which the data will be processed with the new definition.
Click on Redefine.
Related Topics
Shut-in validation is an optional but potentially important part of the shut-in identification procedure when e.g., data quality changes over time, the wavelet filtration + automatic SIID do not always give reliable results. Instead of automatically triggering the different workflows e.g., iPTA on unsatisfactory data, users may want to check the automatically detected shut-ins and only send the ‘good’ ones through.
The option is always enabled when defining the SIID parameters:
![]() |
When Requires validation flag is checked, shut-ins will continue to be identified as normal. However, they will be stored under a Raw Shut-in channel, under the Shut-in channel. The Shut-in channel will not be updated.
This means any process which relies on the Shut-in channel update event, will not be triggered. A user will have to manually validate the raw shut-ins to update the Shut-in channel.
Copy Raw Shut-in to Validated Shut-in plot:
Select the Shut-in channel and click on Shut-in validation among the options at the top, under the Info or Plot tab. In the Shut-in validation mode, the plot options at the top show the following:
Two plots are shown:
Validated Shut-in plot: showing the filtered gauge used to identify shut-ins along with any shut-in copied over from the detected shut-in plot.
Raw Shut-in plot: showing the filtered gauge used to identify shut-ins along with any detected shut-ins.
To validate a shut-in, select the shut-in on the Raw Shut-in plot (click inside the highlighted area to select) and click on Copy to copy it to the Validated Shut-in plot. Alternatively, double click on selected shut-in. Multiple raw shut-ins can be selected by holding the Ctrl key and clicking on them. In the image below, two shut-ins were copied to the Validated Shut-in plot:
The Copy all option allows a one-click way to copy all raw shut-ins to the validated shut-ins pane.
QC copied Shut-ins:
Once copied, the next step is to QC the shut-ins before validating them. Part of the QC could be to ensure the start and end of the Shut-in has been correctly identified.
Select a recently copied shut-in in the Validated Shut-in pane. This will turn the selected shut-in highlight to blue. The vertical lines marking the start and end of the shut-in can now be interactively edited. It is recommended to zoom in on the selected shut-in to make this editing easier.
The Zoom option at the top can be used to zoom in on one shut-in at a time. In this mode, the Date selection drop-down list, the Next and Previous options become available which can be used to toggle between the unvalidated/recently copied shut-ins (see Navigating Through Shut-ins for more details).
Note
For quality control before validation, it is possible to view a loglog plot of the selected shut-in directly in all Shut-In channels. To do so, select the shut-in and click on the Preview loglog,
, icon among the options at the top.
The preview uses Horner superposition, where tp is defaulted to 200 hrs. This value can be edited by the user and the preview will be updated accordingly.
To assist in validating the start and end of the shut-in, the usercan use zoom at Start ,
, and zoom at the End ,
, buttons located in the top option ribbon.
When SIID is based on temperature, it is possible to plot the pressure history alongside temperature gauges. Additionally, the pressure gauge can be plotted in the log-log preview instead of the temperature plot
After reviewing, the type and category of the shut-in can be modified. The shut-in can be classified as Fit or Not Fit for use in terms of type, or as Soft or Hard in terms of category.
To remove a copied shut-in from the Validated Shut-in pane, select it and click on Remove in the plot options at the top.
.
Validate the Shut-in
Once the needed shut-ins have been copied and QC’ed, they can be validated by clicking on Save,
. Any user task, process or workflow that is triggered by a shut-in update will now run automatically.
Validation Range
By default, the validation range will be set from start of the data to the end of the last copied shut-in. It can be interactively moved forward along the timeline to a later time, but not back past the last copied shut-in.
The purpose of this is to highlight part of the data which has already been validated by the user.
![]() |
Edit Validated Shut-in
It is possible to edit validated shut-in data, to make corrections to the validated shut-in by clicking on Edit all shut-ins,.
It is possible to manually select a range for automatic shut-in detection by clicking on Auto shut-in, ,
![]() |